Canadian consumer insolvencies rose significantly in 2023, up 26.2% in Ontario and 23.0% across Canada. Our 2023 insolvency study reveals critical trends in consumer insolvencies, offering insights into the financial challenges faced by insolvent debtors.
Methodology
As required by law, we gather information about each person who files a consumer proposal or personal bankruptcy with us. We examine this data to develop a profile of the average consumer debtor who files for relief from their debt (we call this person “Joe Debtor”). We use this information to gain insight and knowledge as to why consumer insolvencies occur. Our 2023 consumer debt and bankruptcy study reviewed the details of 3,400 personal insolvencies in Ontario from January 1, 2023, to December 31, 2023, and compared the results of this profile with study results conducted since 2011 to identify any trends.
Key Findings
CREDIT CARD DEBT DRIVING CONSUMER INSOLVENCIES IN 2023
Homeowner Insolvencies On the Rise
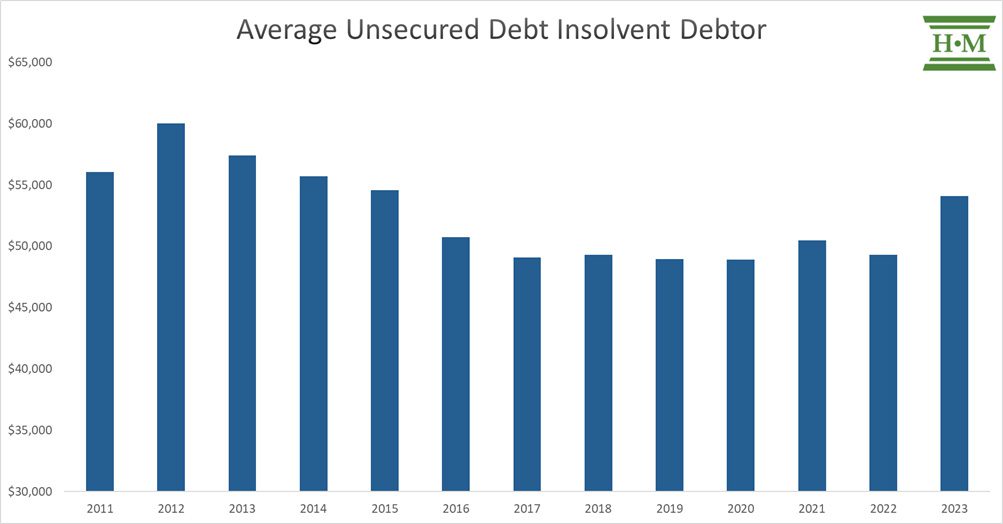
The average insolvent debtor owed $54,084 in unsecured debt, a 9.7% increase from 2022, primarily driven by a resurgence in credit card debt and homeowner insolvencies. The pace of growth was the highest we’ve seen since beginning our study in 2011.
Credit card debt emerged as a notable concern, with 91% of insolvent debtors filing with outstanding credit card balances, averaging $17,816—an increase of 12.8%. Insolvent debtors across all age groups saw a rise in credit card debt, with the most significant increase among debtors aged 18 to 29, whose balances increased 34.5% in 2023.
Higher-income insolvencies became more prevalent in 2023, coinciding with changing demographics. While insolvent debtors aged 30 to 39 continue to represent the largest percentage (31.7%) of all insolvencies, the trend in 2023 was towards an older debtor. Insolvencies involving debtors aged 40 and older increased, rising to 53.4% of all insolvencies from 51.0% in 2022. Rising inflation and interest rates have made it difficult for even higher-income earners to manage heavy debt payments.
Rising mortgage debt and interest rates also impacted homeowner insolvencies. While still historically low, the percentage of homeowner insolvencies doubled in 2023 to 4.0%. Insolvent homeowners had nearly double the unsecured debt ($77,780) of the typical insolvent debtor, as homeowners resort to credit cards to meet rising mortgage payments.
The remainder of this report focuses on the profile of the average insolvent debtor, Joe Debtor.
2023 Consumer Debtor Profile: The Average Insolvent Debtor
The typical insolvent debtor in 2023 was 43 years old, relatively evenly distributed by gender, and half lived in a single-person household.
Joe Debtor owed an average of $54,084 in unsecured debt and an additional $10,490 in non-mortgage secured debt (primarily a car loan or lease). His unsecured debt was 9.7% higher than in 2022.
Below is a summary of debtor characteristics from our 2023 insolvency study.
| Joe Debtor | 2022 | 2023 |
|---|---|---|
| Personal Information | ||
| Male | 50% | 51% |
| Female | 49% | 49% |
| Gender unreported | 1% | 1% |
| Average age | 42.1 | 42.8 |
| Marital status | ||
| Married/Common-law | 30% | 34% |
| Divorced or Separated | 20% | 19% |
| Widowed | 2% | 2% |
| Single | 48% | 45% |
| Average family size (including debtor) | 2.0 | 2.1 |
| Single-person household | 53% | 49% |
| Likelihood of having dependent(s) | 34% | 35% |
| Likelihood of being a lone-parent | 18% | 17% |
| Average monthly income (debtor) | $2,842 | $3,085 |
| Total unsecured debt | $49,316 | $54,084 |
| Consumer debt-to-income | 171% | 174% |
| Likelihood they own a home | 2% | 4% |
| Average mortgage value (homeowner) | $395,545 | $473,575 |
AGE
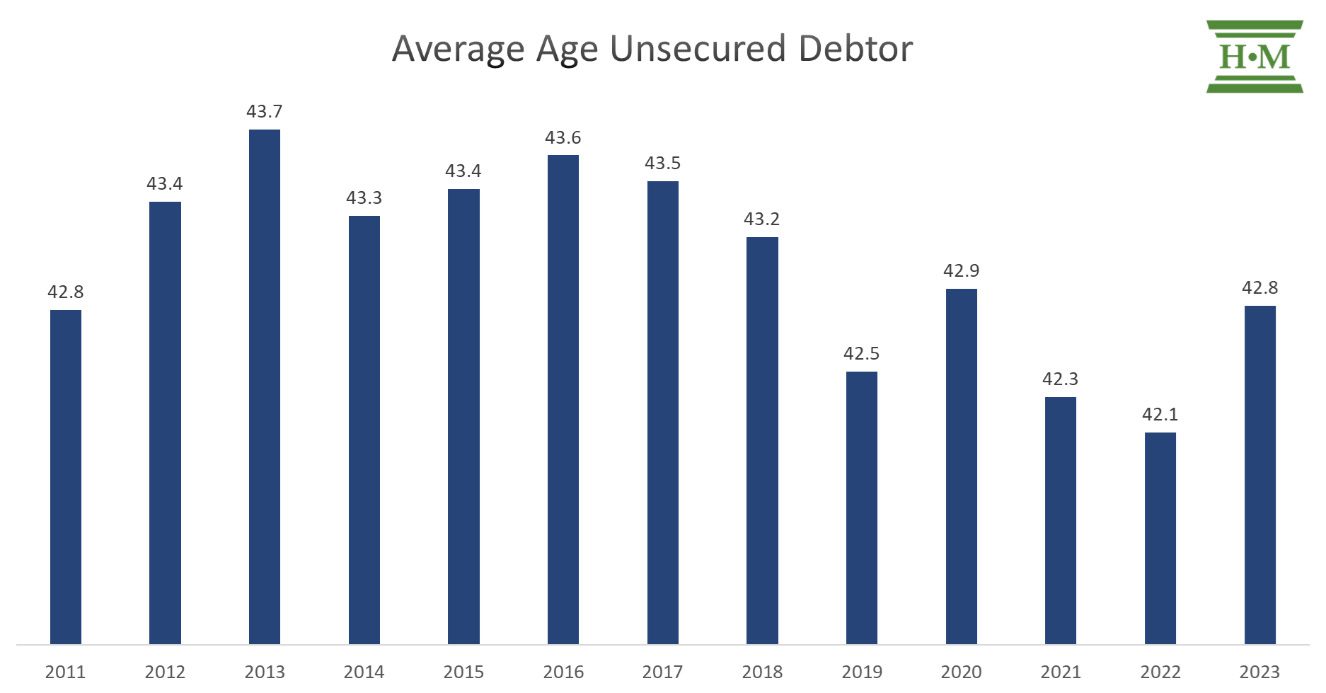
The average insolvent debtor in 2023 was 42.8 years old, eight months older than in 2022 (42.1 years old), reversing a previous trend towards a younger demographic.
Debtors aged 30 to 39 continue to make up the highest percentage of those filing insolvency, accounting for 31.7% of all filings.
In 2023, we saw a significant increase in the proportion of filers aged 50 to 59. Insolvent debtors in that age group had the highest unsecured debt load ($62,427) and the highest increase in unsecured debt (up 17.5% from 2022).
| Age Distribution | 2021 | 2022 | 2023 |
|---|---|---|---|
| 18-29 | 16.4% | 15.3% | 15.0% |
| 30-39 | 31.9% | 33.8% | 31.7% |
| 40-49 | 23.9% | 24.2% | 24.3% |
| 50-59 | 16.3% | 15.6% | 17.4% |
| 60+ | 11.6% | 11.2% | 11.7% |
GENDER
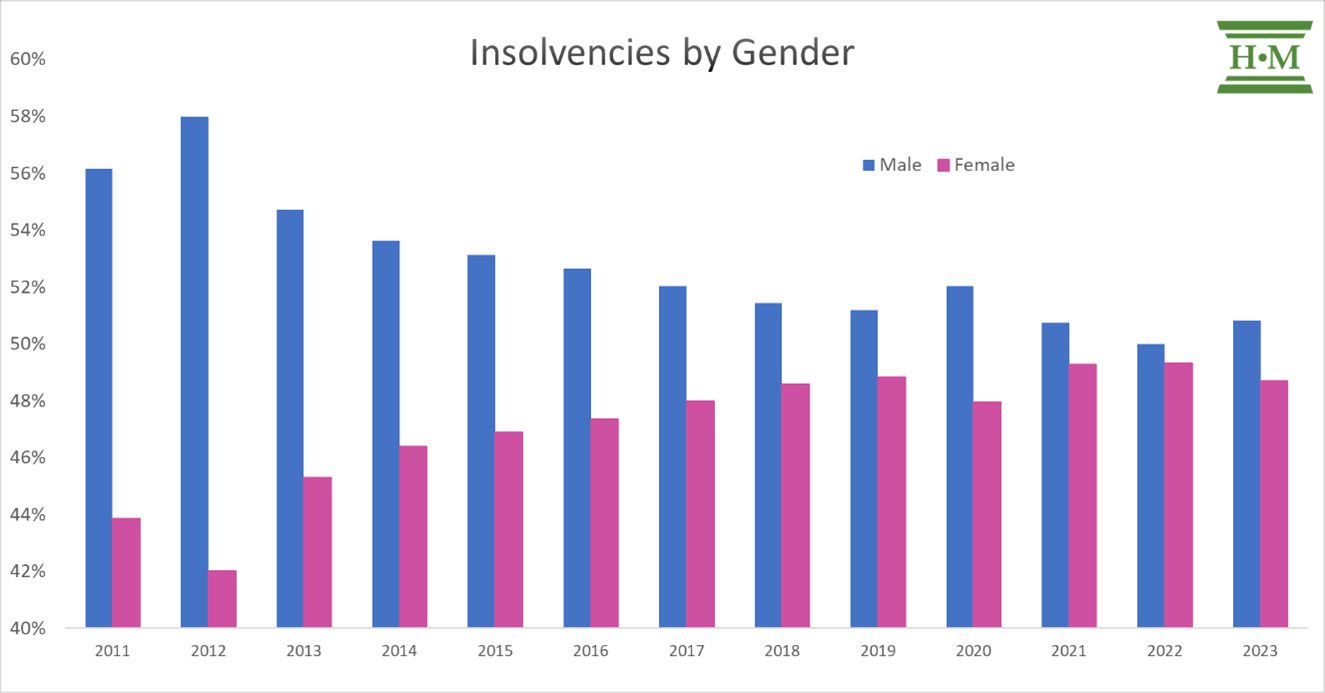
While consumer insolvencies are relatively evenly distributed by gender, we saw a slight shift towards more males filing insolvency than during the previous two years. In 2023, 51% of insolvencies were filed by males, compared to 49% for female debtors.
Male debtors owed, on average, $59,005 in unsecured debt, 20.6% more than female debtors ($48,918).
- Male debtors are slightly younger (42.6) than the average female debtor (43.0).
- Male debtors are more likely to have tax debts (49% versus 42%).
- Although they owed less than the average male debtor, female debtors saw their average unsecured debt increase by 12.8% in 2023, compared to a rise of 7.1% for male debtors.
- Female debtors are more likely than male debtors to be divorced or separated (22% versus 16%), more likely to have dependents (42% versus 28%) and are more likely to be single parents (25% versus 9%).
- Female debtors are also more likely to struggle with student debt (29%) than male debtors (18%).
| Jane/Joe Debtor | Female | Male |
|---|---|---|
| % of all debtors | 49% | 51% |
| Average age | 43.0 | 42.6 |
| Unsecured debt | $48,918 | $59,005 |
| Non-mortgage secured debt | $9,798 | $11,217 |
| Average debtor income | $2,974 | $3,194 |
| Average household income | $3,464 | $3,764 |
| Consumer debt-to-income | 165% | 183% |
| % employed | 79% | 85% |
| % single | 45% | 46% |
| % married | 31% | 38% |
| % divorced | 22% | 16% |
| % with dependant(s) | 42% | 28% |
| % lone-parents | 25% | 9% |
| % with student debt | 29% | 18% |
| Average student debta | $17,496 | $14,633 |
| % with Rapid Loan debt | 49% | 49% |
| Average Rapid Loan debta | $12,338 | $12,348 |
| % with tax debt | 42% | 49% |
| Average tax debta | $13,677 | $26,248 |
| a – those with student loans, Rapid Loans, or tax debt |
MARITAL STATUS AND HOUSEHOLD SIZE
Consistent with the shift towards older files, 2023 saw fewer single insolvent debtors and more married or common law.
| Marital Status | 2021 | 2022 | 2023 |
| Single | 46% | 48% | 45% |
| Married / Common Law | 31% | 30% | 34% |
| Divorced / Separated | 21% | 20% | 19% |
| Widowed | 2% | 2% | 2% |
Average household size increased slightly to 2.1 (from 2.0 in 2022).
| Household Size | 2021 | 2022 | 2023 |
|---|---|---|---|
| 1 | 52% | 53% | 49% |
| 2 | 20% | 21% | 21% |
| 3 | 13% | 11% | 14% |
| 4 | 8% | 10% | 10% |
| 5 | 4% | 4% | 5% |
| 6 or more | 2% | 1% | 2% |
| Average household size | 2.0 | 2.0 | 2.1 |
| % households with a dependent | 36% | 34% | 35% |
| % lone-parents | 17% | 18% | 17% |
| % two-income households | 19% | 16% | 21% |
EMPLOYMENT STATUS AND INCOME PROFILE
In 2023, 82% of insolvent debtors were employed at the time of filing.
| Employment Status | 2021 | 2022 | 2023 |
|---|---|---|---|
| Employed | 70% | 81% | 82% |
| Unemployed | 15% | 7% | 6% |
| Retired | 6% | 5% | 5% |
| Disability | 6% | 5% | 5% |
| Other | 3% | 2% | 2% |
In 2023, the average insolvent debtor’s income rose 8.6% to $3,085, while household income rose by 12.8% to $3,618.
This does not mean, however, that Joe Debtor received a raise of 8.6%. In 2023, we saw fewer lower-income filers and more higher-income insolvencies than in prior years.
| % by Debtor Income Profile | 2021 | 2022 | 2023 |
|---|---|---|---|
| $0 – $1000 | 8% | 6% | 4% |
| $1,001 – $2,000 | 24% | 17% | 13% |
| $2,001 – $3,000 | 37% | 37% | 35% |
| $3,001 – $4,000 | 21% | 26% | 30% |
| $4,001 + | 10% | 14% | 18% |
Insolvent debtors in 2023 were left with just $273 to pay interest and principal payments on $54,084 in unsecured credit. The interest alone on this level of debt for the average debtor amounts to more than $1,933 per month.
DEBT PROFILE OF THE AVERAGE INSOLVENT DEBTOR
The average insolvent debtor in 2023 owed $54,084 in unsecured debt, up 9.7% from 2022, the largest year-over-year increase since we began our study in 2011.
| Consumer Debt Profile | 2021 | 2022 | 2023 |
|---|---|---|---|
| Other personal loans | $15,116 | $14,280 | $16,211 |
| Rapid loansa | $5,026 | $6,427 | $6,087 |
| Credit card debt | $15,004 | $13,848 | $16,199 |
| Tax debts | $7,826 | $8,109 | $9,364 |
| Student loans | $3,797 | $3,675 | $3,835 |
| Other unsecured debt | $3,715 | $2,978 | $2,388 |
| Average unsecured debt | $50,484 | $49,316 | $54,084 |
| Other secured debt | $8,700 | $9,033 | $10,490 |
| Total consumer credit | $59,183 | $58,349 | $64,574 |
| a – payday loans, severe high-interest cash installment loans and lines of credit |
Credit Card Debt is Driving Insolvencies
In the previous two years, Joe Debtor filed insolvency predominantly due to severe high-interest subprime borrowing. We have termed this type of debt “rapid loans”. Rapid loan debt includes all loans from payday lenders (both payday loans and lines of credit) as well as sub-prime high-interest installment loans. While this form of debt is still very high among insolvent debtors (49.3% have a rapid loan), it is down from 53.1% in 2022.
In 2023, we saw the return of credit card debt as problem debt.
In 2023, 91% of insolvent debtors filed insolvency with an outstanding credit card balance, up from 88% in 2022. Average credit card debt among insolvent debtors with a credit card was $17,816, up 12.8%. To put this number in perspective, TransUnion reported that the average Canadian consumer carries credit card balances of just over $4,0001.
| Credit Card Debt by Age Groupa | 2023 | % change |
|---|---|---|
| 18-29 | $12,320 | 34.5% |
| 30-39 | $15,983 | 9.3% |
| 40-49 | $18,331 | 15.8% |
| 50-59 | $21,434 | 7.2% |
| 60+ | $23,296 | 3.8% |
| a – insolvent debtors with a credit card |
All age groups saw a rise in credit card balances in 2023. Older debtors carried the highest balances, consistent with prior years, driven by the slow accumulation of credit card debt over their lifetime. However, insolvent debtors aged 18 to 29 saw the highest year-over-year growth in credit card balances, up 34.5%.
Credit card debt balances are increasing as households use credit to make ends meet in a rising cost environment and as indebted homeowners use credit cards to keep up with mortgage payments.
Tax Obligations Rise
The second trend we saw in 2023 was a continued increase in tax debts among insolvent debtors. Almost half (46%) of all insolvent debtors have tax debt, although this was down from 49% in 2022. However, the total tax debt owed increased to $20,473 for those with a tax debt, an increase of 23.0%.
Rising interest rates have increased the Canada Revenue Agency prescribed rate charged on overdue taxes — reaching 9% in the fourth quarter of 2023, nearly double what it has been for the past decade. The burden of tax repayment for many small businesses and sole proprietorships is a contributing factor in filing insolvency. In 2023, 9% of insolvent debtors reported they were self-employed, up from 8% in 2022.
Payday and High-Interest Rapid Loans
While we saw a decline in the prevalence of high-interest rapid loan debt among insolvent debtors in 2023 (49.3% carried a rapid loan, down from 53.1%), those using rapid loans borrowed more. Average balances among those with a rapid loan increased 2.1% to $12,352.
Debtors aged 60 and older borrowed significantly more, with average rapid loan debt load up 23.7% from a year earlier. Debtors aged 50 to 59 had the most significant balances of rapid loans at $13,830, up 11.1%.
Some other debt statistics for Joe Debtor:
- 23% had student debt, unchanged from 2022. Average student loan debt (among those with student loans) increased by 3.3% to $16,390.
- 67% had a vehicle upon filing, with 61% financed. Rising car values have lowered negative car equity among insolvent debtors. Only 16% of encumbered vehicles had negative equity, down from 19% in 2022 and a pre-covid average of 31%. However, higher car loan debt (an average of $19,239 – up 7.0% in 2023) increased total negative equity to an average of $11,985 for those underwater on their car loans.
Homeowners More Vulnerable
Rising mortgage debt and interest rates have begun to impact homeowner insolvencies.
Although the percentage of insolvent debtors who own a home remains low by historical standards, the rate doubled in 2023. In our 2023 study, 4% of insolvent debtors owned a home, up from 2% in 2022.
The average insolvent homeowner carries a mortgage of $473,575, up 19.7% from a year earlier. On top of this, he owes an average of $98,754 in unsecured debt and $33,204 in non-mortgage secured debt.
Insolvent homeowners filed insolvency with almost double (1.8 times) the unsecured debt of the typical insolvent debtor and double Joe Debtor’s total non-mortgage debt. Vulnerable households often turn to credit cards and lines of credit to keep up with mortgage payments until their credit options are exhausted. Insolvent homeowners with credit card debt (96%) carried an average credit card balance of $32,728.
The average insolvent homeowner had just $41,916 in home equity, less than half their unsecured debt obligations. At just 7.0% of their home value, they have insufficient home equity to refinance and, as a result, file a consumer proposal to deal with their unsecured debt.
Conclusion
Our 2023 insolvency study reveals some critical trends in credit card debt and homeowner insolvencies that offer insight into the financial challenges faced by vulnerable debtors in the Canadian economy. Given these conditions, insolvencies will continue to rise as long as the cost of living and interest rates remain high.
External Sources:
Media Inquiries
If you would like to request an interview or need background information, please contact:
Email Doug: doug@hoyes.com
Email Ted: ted@hoyes.com
or phone 1-866-747-0660.
How to cite: Hoyes, Michalos & Associates Inc. Annual Bankruptcy Study, 2023. Published February 5, 2024. https://www.hoyes.com/press/joe-debtor/
Douglas Hoyes, CPA, Licensed Insolvency Trustee, Co-founder Hoyes Michalos.
Doug was inspired to bring his financial experience to work by helping individual people not corporations rebuild their financial future. Doug advocates for consumers needing debt relief to ensure they receive a fair and respectful debt management solution. He regularly comments in the media including publications and networks such as Canada AM, Global News, CBC, The Globe and Mail, The Toronto Star, Business News Network, The Financial Post and CTV News. Doug also posts regularly to our blog, on Twitter, Google+, and Huffington Post Canada.
Ted Michalos, CPA, Licensed Insolvency Trustee, Co-founder Hoyes Michalos
Ted Michalos strongly believes that debt management advice should be delivered without gimmicks and without tricks. He is enthusiastic about ensuring clients understand all of their options and that Hoyes Michalos helps them develop a custom-tailored plan to deal with their debts. Ted is a prolific writer, contributing answers and advice on our blog and on several insolvency and debt relief sites, including Advisor.ca. He has appeared as an expert on bankruptcy and debt-related matters including appearances on CBC News, Global TV and Business News Network.
Company Background
Hoyes, Michalos & Associates Inc. is a Licensed Insolvency Trustee firm that has provided personal bankruptcy and consumer proposal services to individuals in Ontario since 1999. Co-founded by Doug Hoyes and Ted Michalos, we are one of the largest firms in Canada practicing exclusively in the area of personal insolvency. With offices throughout Ontario, Hoyes Michalos provides real debt management solutions to help Ontarian’s climb out of debt.
Get Industry Insights
Hoyes Michalos issues monthly consumer insolvency updates delivered straight to your inbox. Sign up for future releases and our annual Joe Debtor study.
You can unsubscribe from e-alerts at any time. Read our privacy statement here.
You have been added to our industry insights list. We will notify you as we publish monthly consumer insolvency updates, as well as, share our annual bankruptcy study.
If you would like to request an interview or need background information, please contact:
Email Doug: doug@hoyes.com
Email Ted: ted@hoyes.com
or phone 1-866-747-0660.


