After a sharp rise in consumer insolvencies in 2024, growth in filings moderated in 2025. At the time of publication, annual consumer insolvencies for 2025 are expected to increase by less than 2% nationally and only 1% in Ontario. This apparent stability, however, masks an increased vulnerability in the financial profile of insolvent Canadians that is outlined in this study.
Methodology
As required by law, we gather information about each person who files a consumer proposal or personal bankruptcy with us. We examine this data to develop a profile of the average consumer debtor who files for relief from their debt (we call this person “Joe Debtor”). We use this information to gain insight and knowledge as to why consumer insolvencies occur. Our 2025 consumer debt and bankruptcy study reviewed the details of 3,870 personal insolvencies in Ontario from January 1, 2025, to December 31, 2025, and compared the results of this profile with study results conducted since 2011 to identify any trends.
Key Findings
2025 is not about a new kind of debt problem. Instead, it is about more debt, spread across more accounts, with larger balances.
The defining feature of consumer insolvency in 2025 is scale and accumulation. Canadians filing insolvency in 2025 had higher total debt, spread across more accounts, with larger balances.
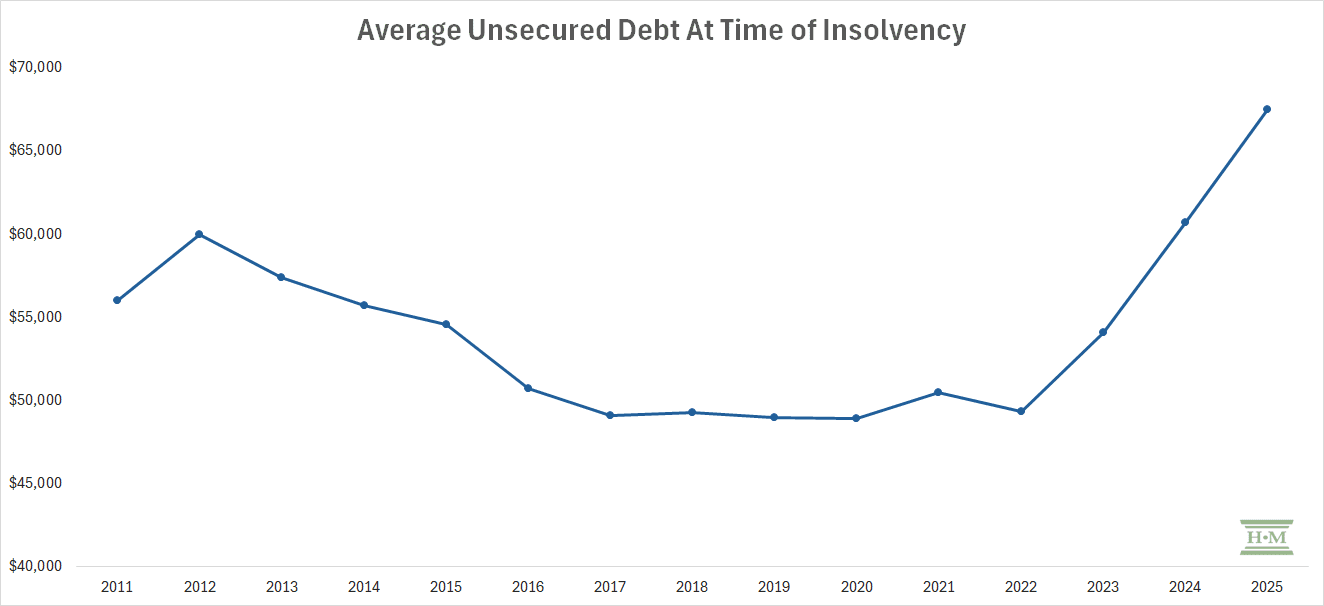
Average unsecured debt among insolvent debtors reached $67,496, the highest level since we began our study in 2011. An intensity of growth that began in 2023 has continued, with overall debt loads up an astounding 11.2% over the prior year, and a total of 36.9% over the past three years.
Accumulation and Scale
The 2025 insolvency profile is characterized by scale and accumulation rather than the emergence of a single dominant debt type or isolated economic trigger.
In 2025, insolvent debtors carried:
- More total unsecured debt
- A greater number of creditors
- More credit cards
- More payday loans
- Higher balances across almost every major debt category
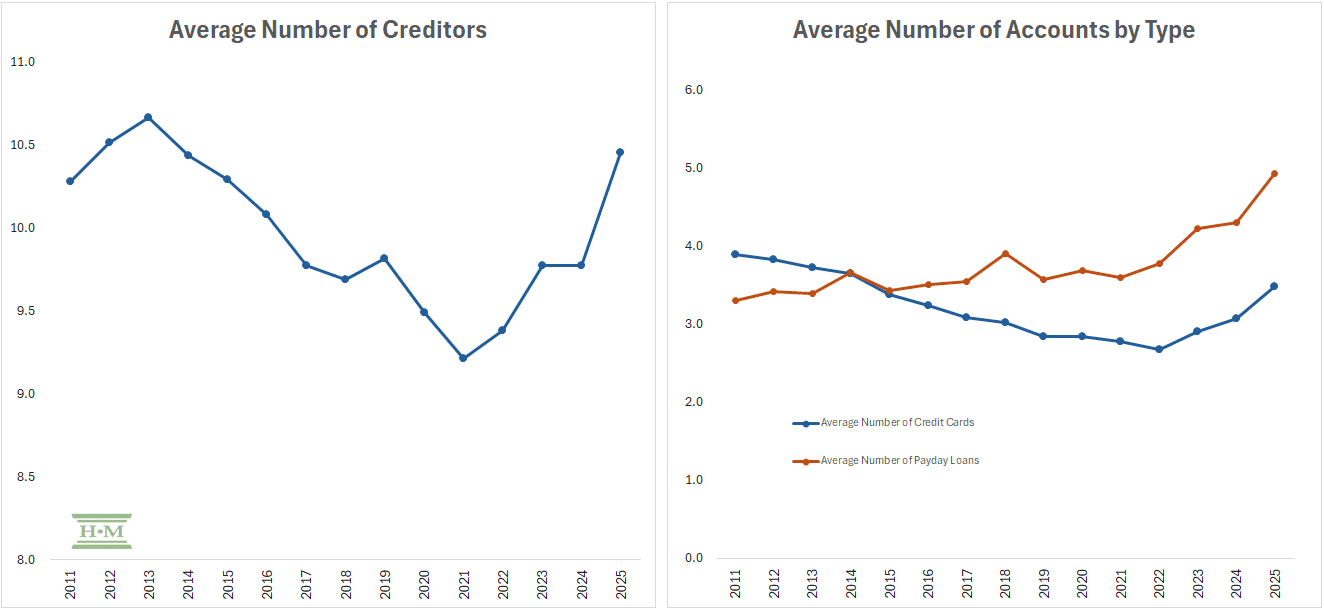
Canadians did not file insolvency because of a single bad credit debt decision. They were layering borrowing on top of borrowing. The average number of creditors per debtor rose to 10.5, up 7.0% from 2024, the highest level we’ve seen since 2013. The average number of credit cards increased to 3.5, a 13.3% increase in just one year. And while fewer filers rely on payday loans as a primary trigger, those who do now carry more payday loans than ever (4.9 compared to 4.3 in 2024).
To put it simply, 2025 insolvencies were not driven by a single financial trigger, but by the cumulative weight of multiple debts spread across too many accounts with higher borrowing limits.
Housing-Related Insolvency Risk Is Emerging
While homeowners still represent a small share of insolvency filings, they accounted for 8% of insolvencies in 2025, up from 5% a year earlier. A growing percentage of insolvent homeowners are filing with negative home equity, with nearly 1 in 4 (23%) homeowner insolvencies involving negative equity. At the same time, unsecured debt among insolvent homeowners increased 12.6%, adding to the financial pressures of their mortgage debt.
Why Insolvencies Haven’t Surged
Consumer insolvencies increased by only 1.2% in Ontario and 1.4% nationally in the first 11 months of 2025.
Our data shows that 2025 represents a continuation of a structural shift that began in 2023. Insolvency is no longer primarily driven by isolated debt problems or short-term economic shocks. Instead, many Canadians are managing financial pressures by taking on additional credit thereby delaying, rather than avoiding, insolvency.
As a result, insolvency volumes have remained relatively contained in 2025, despite worsening debt profiles and a broader reliance on multiple credit products.
That said, the composition of insolvency filings shifted modestly in 2025. Bankruptcies increased at a faster pace than consumer proposals, rising 9.2% in Ontario compared to a 0.5% increase in proposals. Nationally, bankruptcies rose 2.7% while proposals increased by 1.0%. This may be an early sign of household economic and income insecurity among heavily indebted households. Debtors who are concerned their income may decline are less likely to commit to a consumer proposal.
Who Files Insolvency in Canada? 2025 Insolvent Debtor Profile
The typical insolvent debtor in 2025 was 42 years old and more likely to be male. Joe Debtor owed an average of $67,496 in unsecured debt and an additional $12,001 in non-mortgage secured debt (primarily a car loan or lease).
Compared to prior years, the 2025 debtor profile reflects higher debt burdens, increased homeownership risk, and a modest shift toward male and married filers.
| Joe Debtor | 2024 | 2025 |
|---|---|---|
| Personal Information | ||
| Male | 51% | 54% |
| Female | 48% | 45% |
| Gender unreported | 1% | 1% |
| Average age | 42.3 | 42.3 |
| Marital status | ||
| Married/Common-law | 35% | 37% |
| Divorced or Separated | 19% | 17% |
| Widowed | 1% | 2% |
| Single | 45% | 44% |
| Average family size (including debtor) | 2.1 | 2.0 |
| Single-person household | 49% | 49% |
| Likelihood of having dependent(s) | 37% | 37% |
| Likelihood of being a lone-parent | 17% | 15% |
| Average monthly income (debtor) | $3,237 | $3,434 |
| Total unsecured debt | $60,678 | $67,496 |
| Consumer debt-to-income | 188% | 193% |
| Likelihood they own a home | 5% | 8% |
AGE
In 2025, the average age of insolvent debtors was 42.3 years, unchanged from a year earlier.
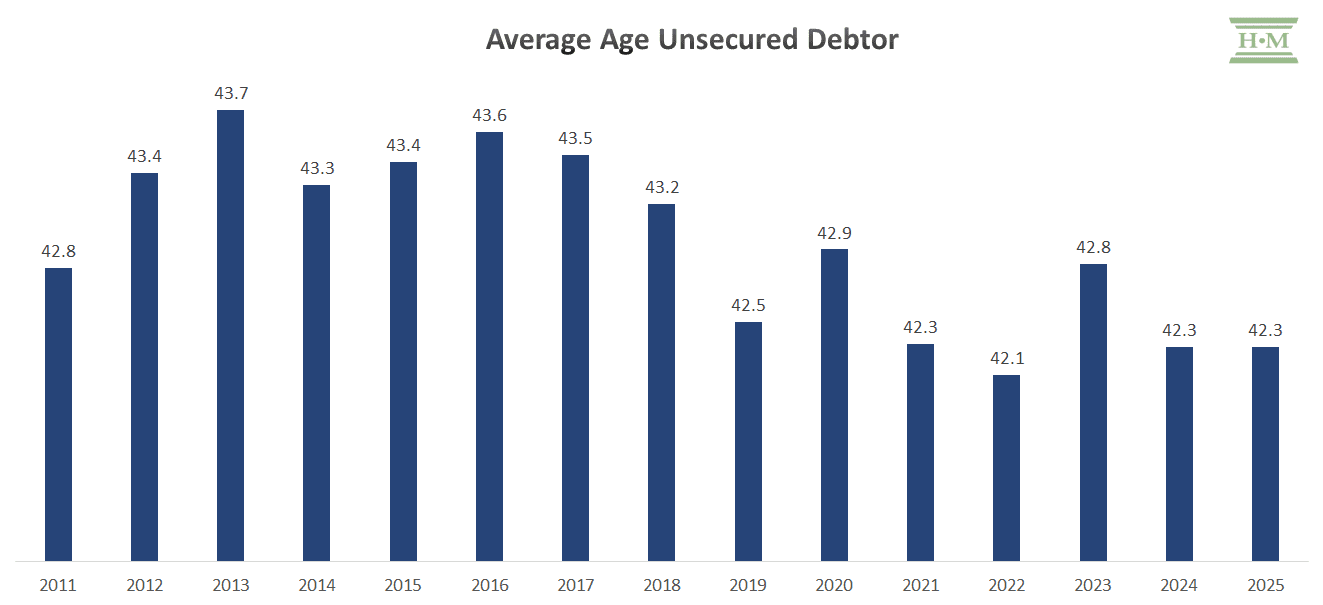
Although the average age remained unchanged, the age distribution shifted modestly in 2025, with a higher share of both younger (18–39) and senior (60+) debtors filing insolvency.
| Age Distribution | 2023 | 2024 | 2025 |
|---|---|---|---|
| 18-29 | 15.0% | 15.1% | 15.5% |
| 30-39 | 31.7% | 32.0% | 33.2% |
| 40-49 | 24.3% | 25.6% | 24.8% |
| 50-59 | 17.4% | 16.3% | 15.0% |
| 60+ | 11.7% | 10.7% | 11.5% |
GENDER
After years where men and women filed insolvency at roughly the same rates, more men filed in 2025 (54% versus 51% in 2024).
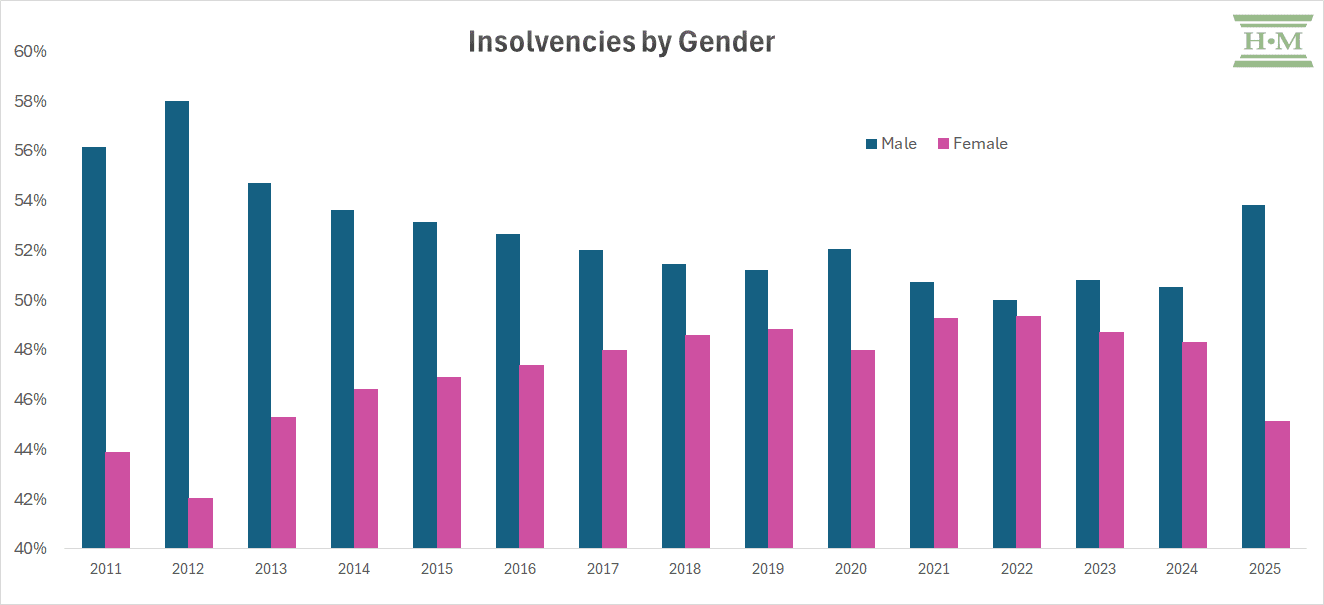
Male debtors carried higher unsecured debt levels than female debtors in 2025, averaging $74,681 compared to $58,440. This difference in debt profiles, combined with the higher share of male filers, contributed to the higher average unsecured debt across all insolvent debtors in 2025.
Comparatively:
- Male debtors were more likely to file with tax debt (44% vs 37%)
- Female debtors were more likely to file with student loan debt (29% vs 19%)
- Male debtors were slightly less likely to file with credit card debt (94% vs 96%) but tended to carry more credit cards (3.7 vs 3.3 for women)
Women debtors were more likely to file with payday loans (35% vs 32% for men)
| Jane/Joe Debtor | Female | Male |
|---|---|---|
| % of all debtors | 45% | 55% |
| Average age | 43.7 | 41.2 |
| Unsecured debt | $58,440 | $74,681 |
| Non-mortgage secured debt | $10,450 | $13,308 |
| Average debtor income | $3,299 | $3,548 |
| Average household income | $3,899 | $4,195 |
| Consumer debt-to-income | 174% | 207% |
| % employed | 81% | 88% |
| % single | 44% | 43% |
| % married | 32% | 42% |
| % divorced | 21% | 14% |
| % with dependant(s) | 43% | 32% |
| % lone-parents | 23% | 8% |
| % with student debt | 29% | 19% |
| Average student debta | $19,348 | $13,986 |
| % with payday loan debt | 35% | 32% |
| Average payday loan debta | $7,969 | $8,899 |
| % with tax debt | 37% | 44% |
| Average tax debta | $18,603 | $33,652 |
| a – those with student loans, payday loans, or tax debt |
MARITAL STATUS AND HOUSEHOLD SIZE
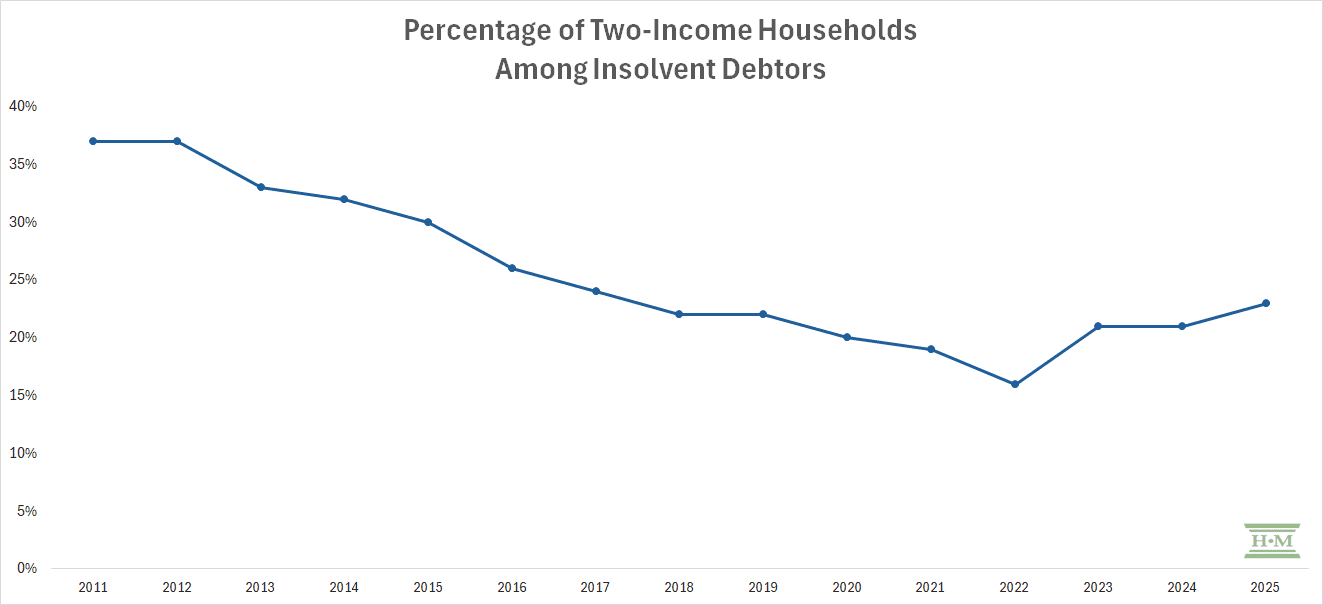
While single individuals continue to account for the largest share (44%) of insolvency filings, the proportion of married or common-law filers rose to 37% in 2025, up from 35% in 2024. Household size remained largely unchanged in 2025; however, the predominance of two-income households among insolvent debtors continued to increase, reaching 23%, levels not seen since 2017. These shifts align with an increase in homeowner insolvencies, which rose to 8% of filings, compared to 5% in 2024.
| Marital Status | 2023 | 2024 | 2025 |
| Single | 45% | 45% | 44% |
| Married / Common Law | 34% | 35% | 37% |
| Divorced / Separated | 19% | 19% | 17% |
| Widowed | 2% | 1% | 2% |
| Household Size | 2023 | 2024 | 2025 |
|---|---|---|---|
| 1 | 49% | 49% | 49% |
| 2 | 21% | 21% | 22% |
| 3 | 14% | 13% | 13% |
| 4 | 10% | 10% | 10% |
| 5 | 5% | 4% | 4% |
| 6 or more | 2% | 2% | 2% |
| Average household size | 2.1 | 2.1 | 2.0 |
| % households with a dependent | 35% | 37% | 37% |
| % lone-parents | 17% | 17% | 15% |
| % two-income households | 21% | 21% | 23% |
EMPLOYMENT STATUS AND INCOME PROFILE
Most individuals filing insolvency in 2025 were employed at the time of filing, with the proportion employed rising to 85% from 83% in 2024. Male debtors are more likely to be employed at the time of filing (88% compared to 81% for female debtors).
| Employment Status | 2023 | 2024 | 2025 |
|---|---|---|---|
| Employed | 82% | 83% | 85% |
| Unemployed | 6% | 7% | 8% |
| Retired | 5% | 5% | 6% |
| Disability | 5% | 3% | 1% |
| Other | 2% | 1% | 1% |
The average monthly income of insolvent individuals rose by 6.1% to $3,434 in 2025, while average household income increased by 6.9% to $4,060. While women tend to earn less than male debtors, income growth between men and women was comparable in 2025 (5.9% vs. 5.4%). While income was higher across all age groups, those aged 40-59 saw the largest increase.
| Average Debtor Income | 2023 | 2024 | 2025 |
|---|---|---|---|
| Average Debtor | $3,085 | $3,237 | $3,434 |
| Male | $3,194 | $3,352 | $3,548 |
| Female | $2,974 | $3,129 | $3,299 |
| 18-19 | $2,782 | $2,787 | $2,923 |
| 30-39 | $3,201 | $3,362 | $3,559 |
| 40-49 | $3,292 | $3,482 | $3,741 |
| 50-59 | $3,093 | $3,291 | $3,530 |
| 60+ | $2,719 | $2,834 | $2,972 |
HOMEOWNERS
Homeowner insolvencies increased in 2025, with homeowners accounting for 8% of insolvency filings, up from 5% in 2024. While still a small share of total filings, this represents a meaningful shift in the homeowner profile of insolvent debtors.
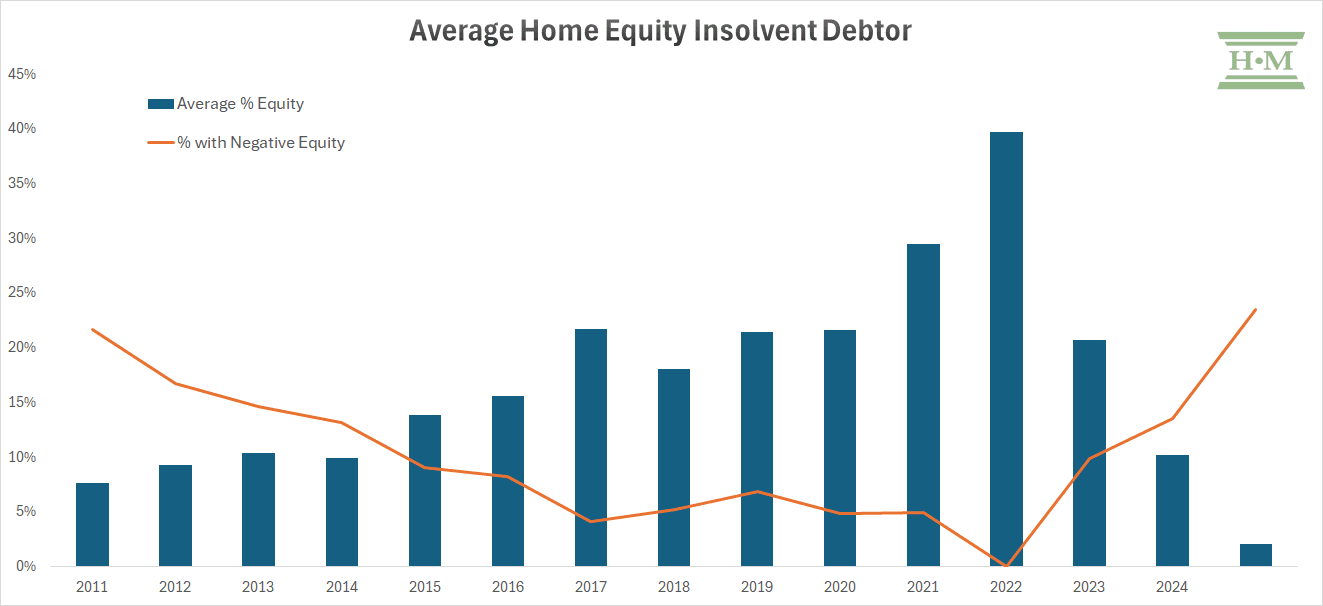
The financial position of these homeowners has weakened. Average home equity among insolvent homeowners fell to just 2% in 2025, and nearly one in four (23%) filed insolvency with negative equity in their home.
With limited or negative equity, insolvent homeowners have fewer options to refinance or consolidate obligations through a mortgage or other secured lending, increasing reliance on unsecured borrowing to manage existing payments.
As a result, insolvent homeowners carried substantial unsecured debt, averaging $111,995 in 2025, 12.6% higher than a year earlier. While they were less likely than other debtors to hold payday loans or student debt, nearly all homeowner debtors (99%) filed with credit card debt. Average credit card balances among homeowners reached $47,197—approximately twice the average balance held by non-homeowners ($23,740).
DEBT PROFILE OF THE AVERAGE INSOLVENT DEBTOR
The average insolvent debtor in 2025 owed $67,496 in unsecured debt, up 11.2% from a year earlier. While debt levels increased across all major unsecured categories, credit card balances accounted for the largest share of overall growth.
| Consumer Debt Profile | 2023 | 2024 | 2025 |
|---|---|---|---|
| Personal loans | $22,298 | $22,681 | $24,550 |
| Credit card debt | $16,199 | $20,398 | $24,527 |
| Tax debts | $9,364 | $9,092 | $11,357 |
| Student loans | $3,835 | $3,968 | $4,046 |
| Other unsecured debt | $2,388 | $4,539 | $3,015 |
| Average unsecured debt | $54,084 | $60,678 | $67,496 |
| Other secured debt | $10,490 | $12,255 | $12,001 |
| Total consumer credit | $64,574 | $72,933 | $79,497 |
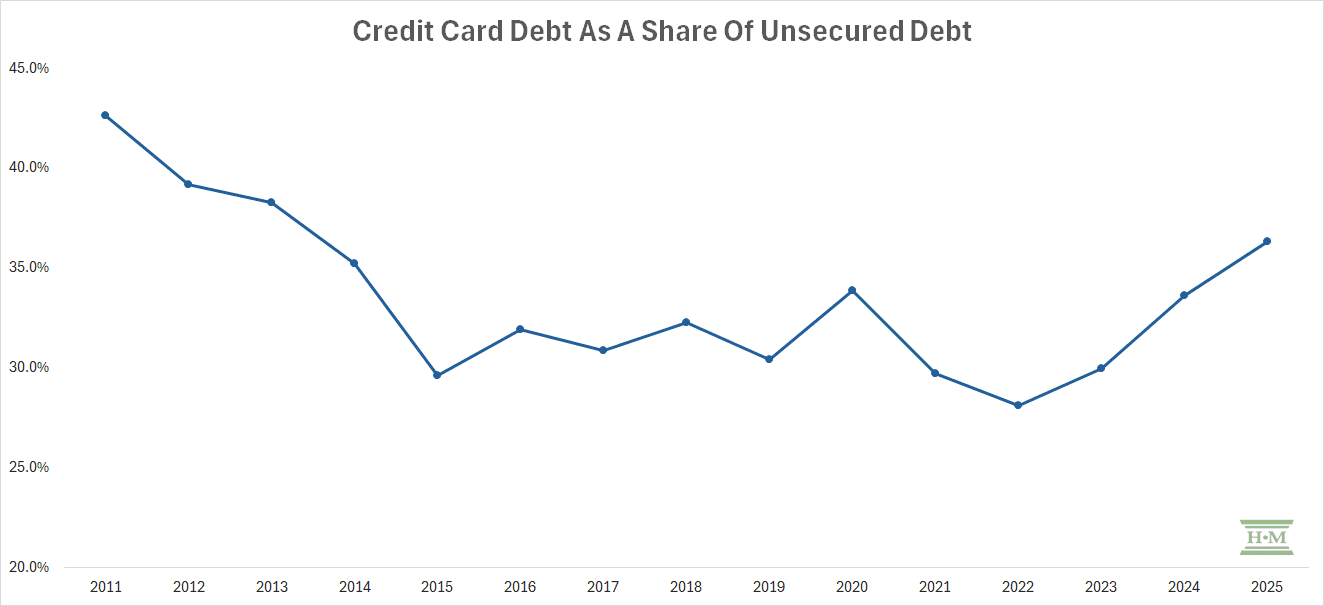
Credit Card Debt Once Again the Leading Debt Driver
Credit card debt was again the dominant contributor to insolvencies in 2025, with average balances across all debtors increasing by 20.2% from the prior year. Credit cards accounted for 36% of total unsecured debt, the highest share observed since 2013, when fewer alternative borrowing options were available.
Average credit card balances increased most sharply among younger debtors. Individuals aged 18–29 recorded a 28.3% increase, the largest across all age groups. Growth was also elevated among debtors aged 30–39 and 40–49. While older debtors continued to hold higher average balances, the faster pace of growth among younger filers suggests that younger debtors have returned to using credit cards sooner, largely driven by current economic pressures like inflation and higher rent costs.
| Credit Card Debt by Age Groupa | 2025 | % change |
|---|---|---|
| 18-29 | $19,201 | 28.3% |
| 30-39 | $24,389 | 18.4% |
| 40-49 | $28,324 | 17.1% |
| 50-59 | $27,999 | 7.9% |
| 60+ | $29,720 | 7.9% |
| a – insolvent debtors with a credit card |
Personal Loans Also Rising
Personal loans include loans from traditional lenders, financing companies, new online or fintech lenders, traditional payday lenders and private loans. They include overdrafts, lines of credit, installment loans, payday loans and vehicle loan shortfalls.
Personal loans increased a total of 8.2%, much higher than the 1.7% increase we saw last year.
Payday Loans
While the share of insolvent debtors with payday loans edged down slightly to 33% in 2025, those who relied on payday lending carried more loans and larger balances. The average number of payday loans per insolvent borrower increased to 4.9, up from 4.3 in 2024, and average payday loan balances (for those with a payday loan) rose to $8,405, a 9.2% increase year over year.
At the same time, use of Buy Now, Pay Later products continued to rise among borrowers, reflecting growing reliance on new financing alternatives to both credit cards and payday loans.
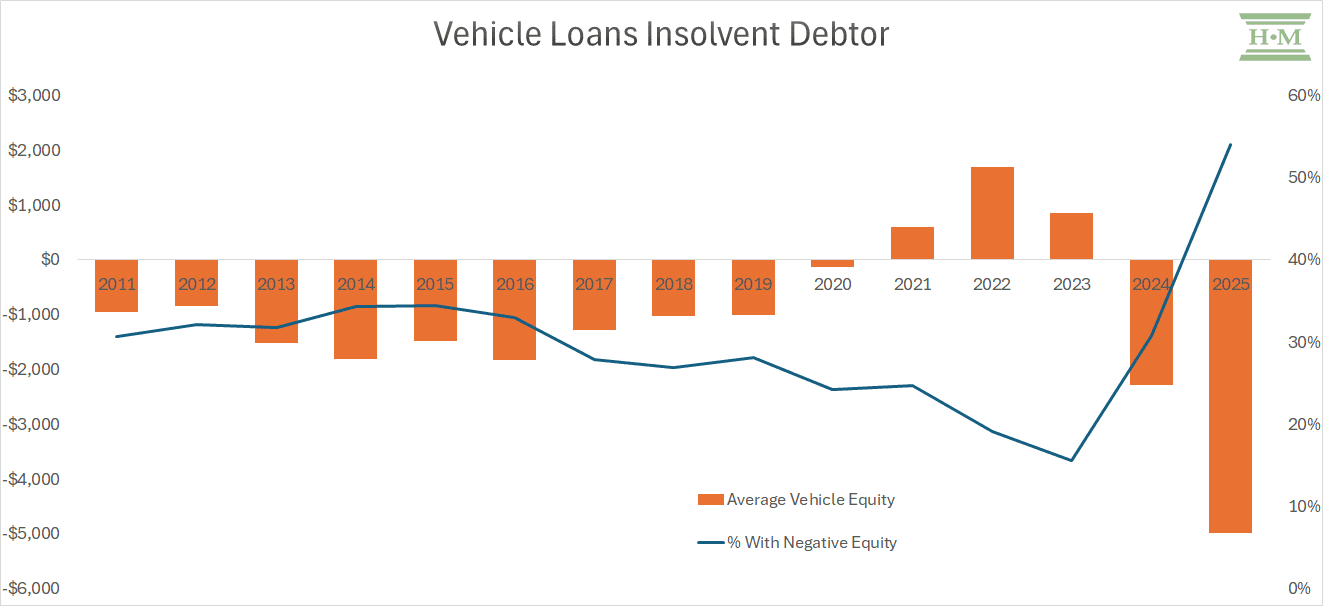
Vehicles Loan Shortfalls Increase
More than half (54%) of insolvent debtors with a vehicle loan faced a loan shortfall. This is up from 31% in 2024 and just 16% in 2023. The average value of a financed vehicle was $17,932, against which they had a secured loan of $22,917 resulting in an average shortfall of $4,985.
Tax Prevalence Down, Balances Higher
The share of insolvent debtors with tax obligations declined for the second consecutive year, falling to 41% in 2025 from 43% the year prior. In other words, a smaller proportion of insolvencies are being driven primarily by tax debt. However, among those who did owe taxes, average tax balances increased sharply, rising 30.1% to $27,694. This increase coincided with a rise in self-employed debtors, who accounted for 13% of insolvency filings in 2025—the highest level observed in this study.
Student Debt Stabilized
The prevalence of student loan debt was largely unchanged at 24% of debtors. Average balances were also unchanged, up just 0.3% to $17,022. Student debtors are still predominantly female (55%), with female student debtors owing an average of $19,348 compared to $13,986 for males.
Insolvency Predictions for 2026
Despite record-high Canadian household debt levels, insolvency filings remained relatively stable through 2025. This stability should not be interpreted as an improvement in financial health. Rather, it reflects the ability of highly indebted households to temporarily manage rising obligations by borrowing more, forgoing expenditures where they can, and prioritizing minimum payments. These strategies delay insolvency, but they do not eliminate underlying financial stress.
Total Canadian household credit card debt increased 3.6% year over year as of October 2025. Bank of Canada data indicates that the share of indebted borrowers behind 60 days or more on payments was 2.11% as of the third quarter of 2025, compared to 2.04% a year earlier. The underlying pressure in the financial system is mounting, not decreasing.
As this study shows, debtors are entering insolvency later in the debt cycle, with higher balances and more accounts, suggesting that financial stress is being stored rather than resolved.
Household coping capacity, however, is finite. Once borrowing capacity is exhausted and cash flow survival strategies fail, filings tend to spike.
Interest rate shocks are also still working through the system. Mortgage and loan renewals at higher interest rates take time to translate into homeowner insolvency filings. We are at the beginning of this cycle now as seen by the rise in homeowner insolvencies in 2025. A significant mortgage renewal wave in 2026 is expected to materially increase monthly payment obligations for many households, increasing insolvency risk in 2026 and 2027 for those already carrying unsecured debt.
Home equity has delayed insolvency for some households, but this buffer is eroding. As this study demonstrates, a growing share of insolvent homeowners are filing with little or negative equity and high unsecured debt, limiting their ability to refinance or consolidate. As these constraints persist, homeowner insolvencies are likely to increase.
The core takeaway is that the current insolvency cycle is not about new financial problems or isolated economic triggers. It is about years of accumulated debt growth and deferred financial stress that has become increasingly difficult to manage. For this reason, we expect personal insolvency filings to rise in 2026, potentially by as much as 20%, as delayed filings begin to materialize and coping mechanisms fail.
Media Inquiries
If you would like to request an interview or need background information, please contact:
Email Doug: doug@hoyes.com
Email Ted: ted@hoyes.com
or phone 1-866-747-0660.
How to cite: Hoyes, Michalos & Associates Inc. Annual Bankruptcy Study, 2025. Published February 9, 2026. https://www.hoyes.com/press/joe-debtor/

J. Douglas Hoyes
BA, CA, CPA, CIRP, CBV, LIT
Licensed Insolvency Trustee
Doug was inspired to bring his financial experience to work by helping individual people not corporations rebuild their financial future. Doug advocates for consumers needing debt relief to ensure they receive a fair and respectful debt management solution. He regularly comments in the media including publications and networks such as Canada AM, Global News, CBC, The Globe and Mail, The Toronto Star, Business News Network, The Financial Post and CTV News. Doug also posts regularly to our blog and on Twitter. He is the author of the personal finance book Straight Talk on Your Money – The Biggest Financial Myths and Mistakes… and How to Avoid Them.

Ted Michalos
BAS, CPA, LIT
Licensed Insolvency Trustee
Ted Michalos strongly believes that debt management advice should be delivered without gimmicks and without tricks. He is enthusiastic about ensuring clients understand all of their options and that Hoyes Michalos helps them develop a custom-tailored plan to deal with their debts. Ted is a prolific writer, contributing answers and advice on our blog and on several insolvency and debt relief sites, including Advisor.ca. He has appeared as an expert on bankruptcy and debt related matters including appearances on CBC News, Global TV and Business News Network.
Debt Free in 30 Podcast
A podcast where Doug Hoyes talks to expert guests each week about your finances. Listen each week for practical advice to manage debt and understand your money choices.
Straight Talk on Your Money

Straight Talk on Your Money by Doug Hoyes
You deserve straight talk on your money but you don’t always get that when you walk into a bank or talk to a financial advisor.
Based on 30 years of experience helping individuals deal with debt, Doug Hoyes reveals 22 common money myths and provides the practical advice you need to make sound decisions so you can live a debt free and stress free life.
Now available at better bookstores across Canada. Also available at Amazon.ca and Indigo.ca including Kindle, Kobo formats and Audible.
As seen on:
Company Background
Hoyes, Michalos & Associates Inc. is a Licensed Insolvency Trustee firm that has provided personal bankruptcy and consumer proposal services to individuals in Ontario since 1999. Co-founded by Doug Hoyes and Ted Michalos, we are one of the largest firms in Canada practicing exclusively in the area of personal insolvency. With offices throughout Ontario, Hoyes Michalos provides real debt management solutions to help Ontarian’s climb out of debt.
Get Industry Insights
Hoyes Michalos issues monthly consumer insolvency updates delivered straight to your inbox. Sign up for future releases and our annual Joe Debtor study.