
Hoyes, Michalos has been tracking and reporting on homeowner insolvencies since 2007. Our homeowner insolvency index peaked in 2011 at 29.1% and has fallen steadily, reaching a low of 1.6% in 2022 and rising to 4.2% in the first two months of 2024.
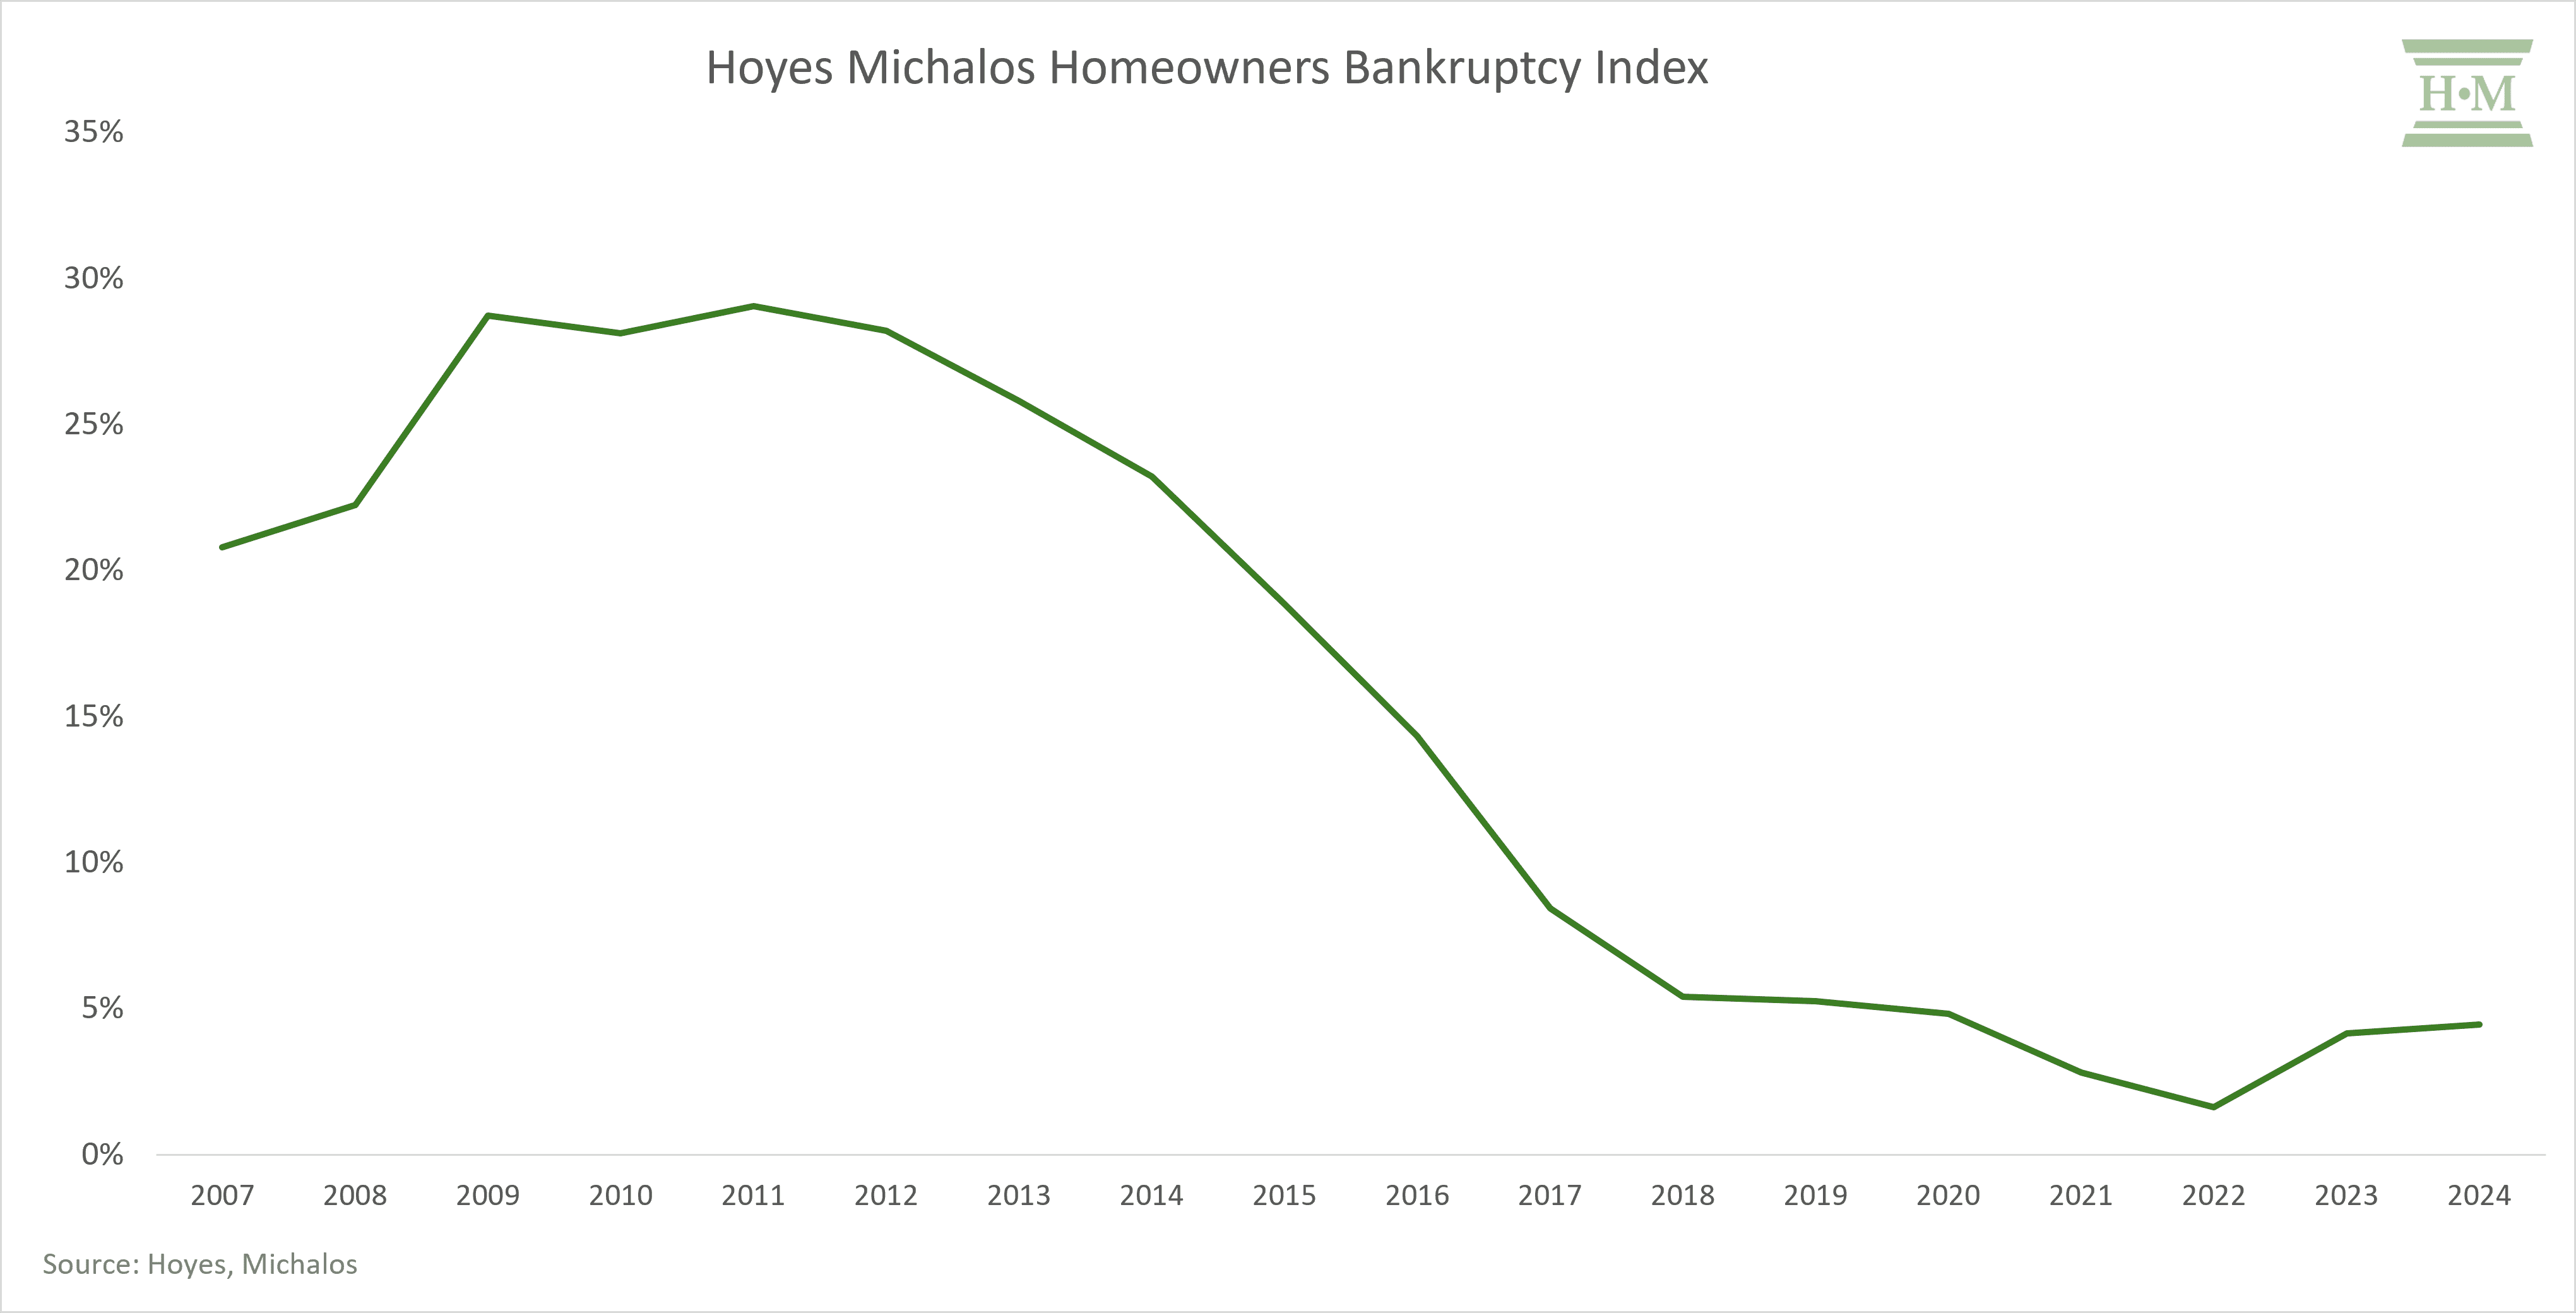
Until recently, homeowner insolvencies have been depressed due to rising home prices, allowing heavily indebted and vulnerable homeowners to tap into the resulting rising home equity to refinance rather than file insolvency.
Changes in the mortgage and housing market, which we will look at shortly, have resulted in a slight rise in homeowner insolvencies over the past two years. Given these changes, we expect to see an increase in homeowner insolvencies over the next two to three years.
What Does The Typical Insolvent Homeowner Look Like?
The average homeowner files insolvency with significantly more unsecured debt than a non-homeowner. In 2023, the average insolvent homeowner owed $98,754 in unsecured debt, almost double (1.8 times) that of Joe Debtor. That debt is more likely to be traditional bank loans and credit card debt (74%) than Joe Debtor (60%), likely due to a better credit score and average higher income.
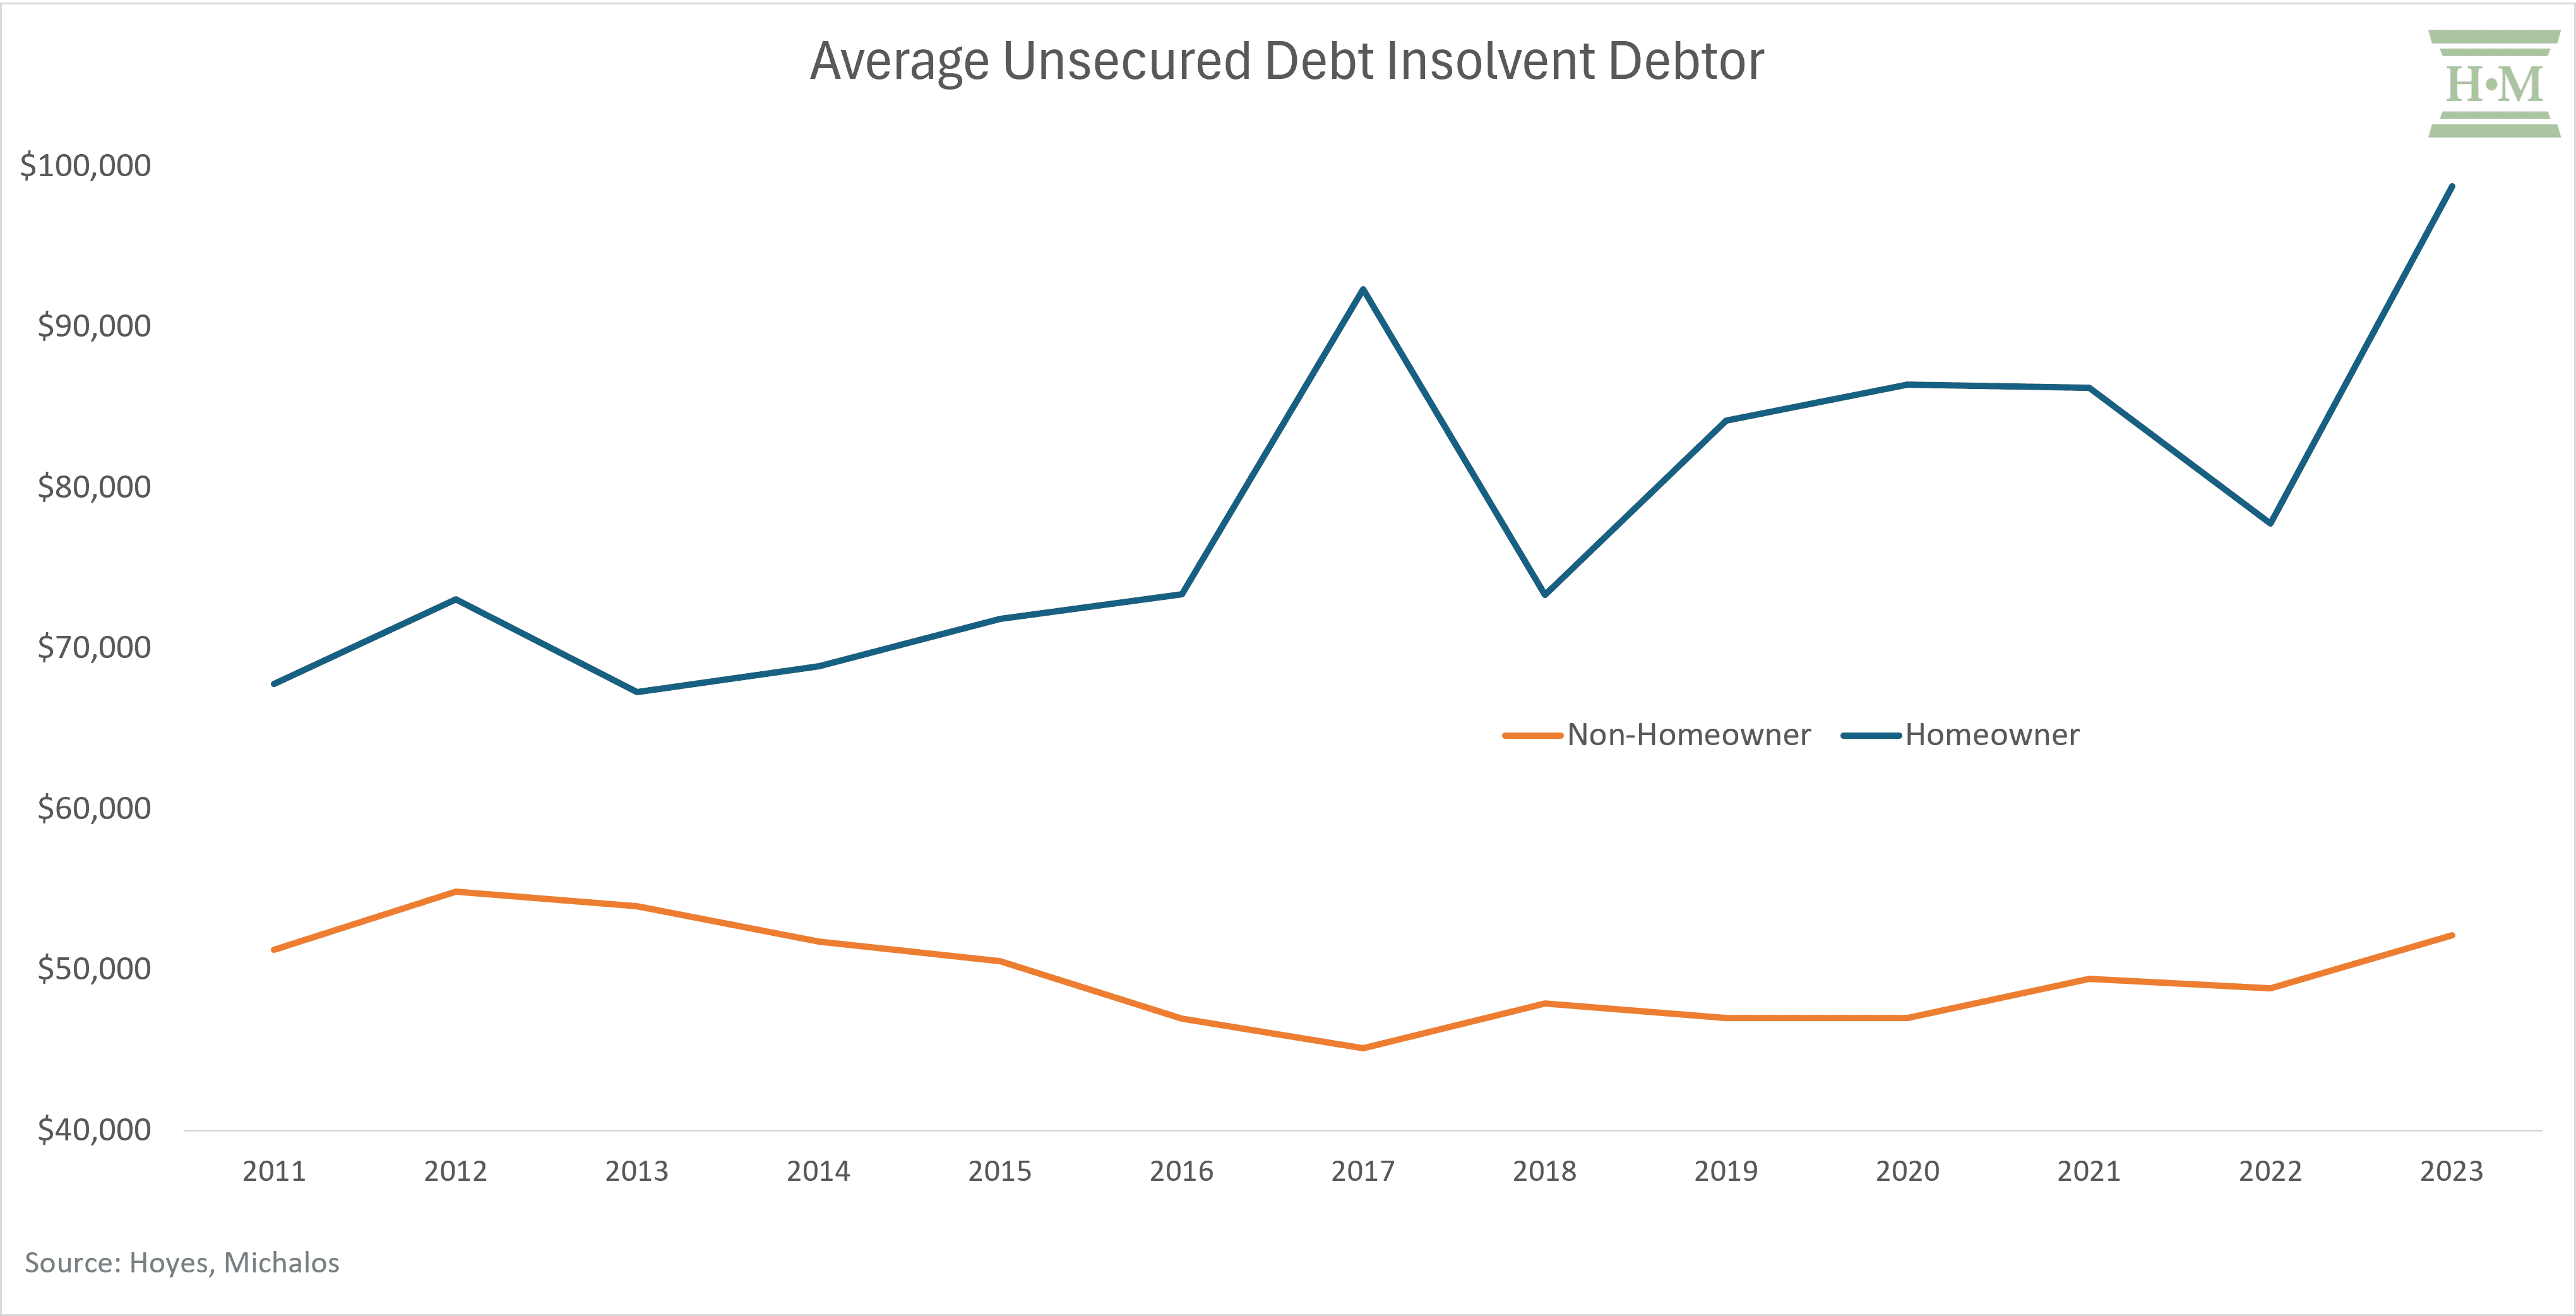
While rising housing values slowed homeowner insolvencies in recent years, that same increase contributed to a steady rise in unsecured debt among homeowners.
To keep up with mortgage payments, heavily indebted homeowners will drive up credit card balances and borrow from other sources until their credit capacity runs out. Once they can no longer access new unsecured credit, they must refinance or file insolvency.
What makes an indebted homeowner vulnerable to insolvency is not only rising consumer credit but also insufficient home equity to refinance their unsecured debt.
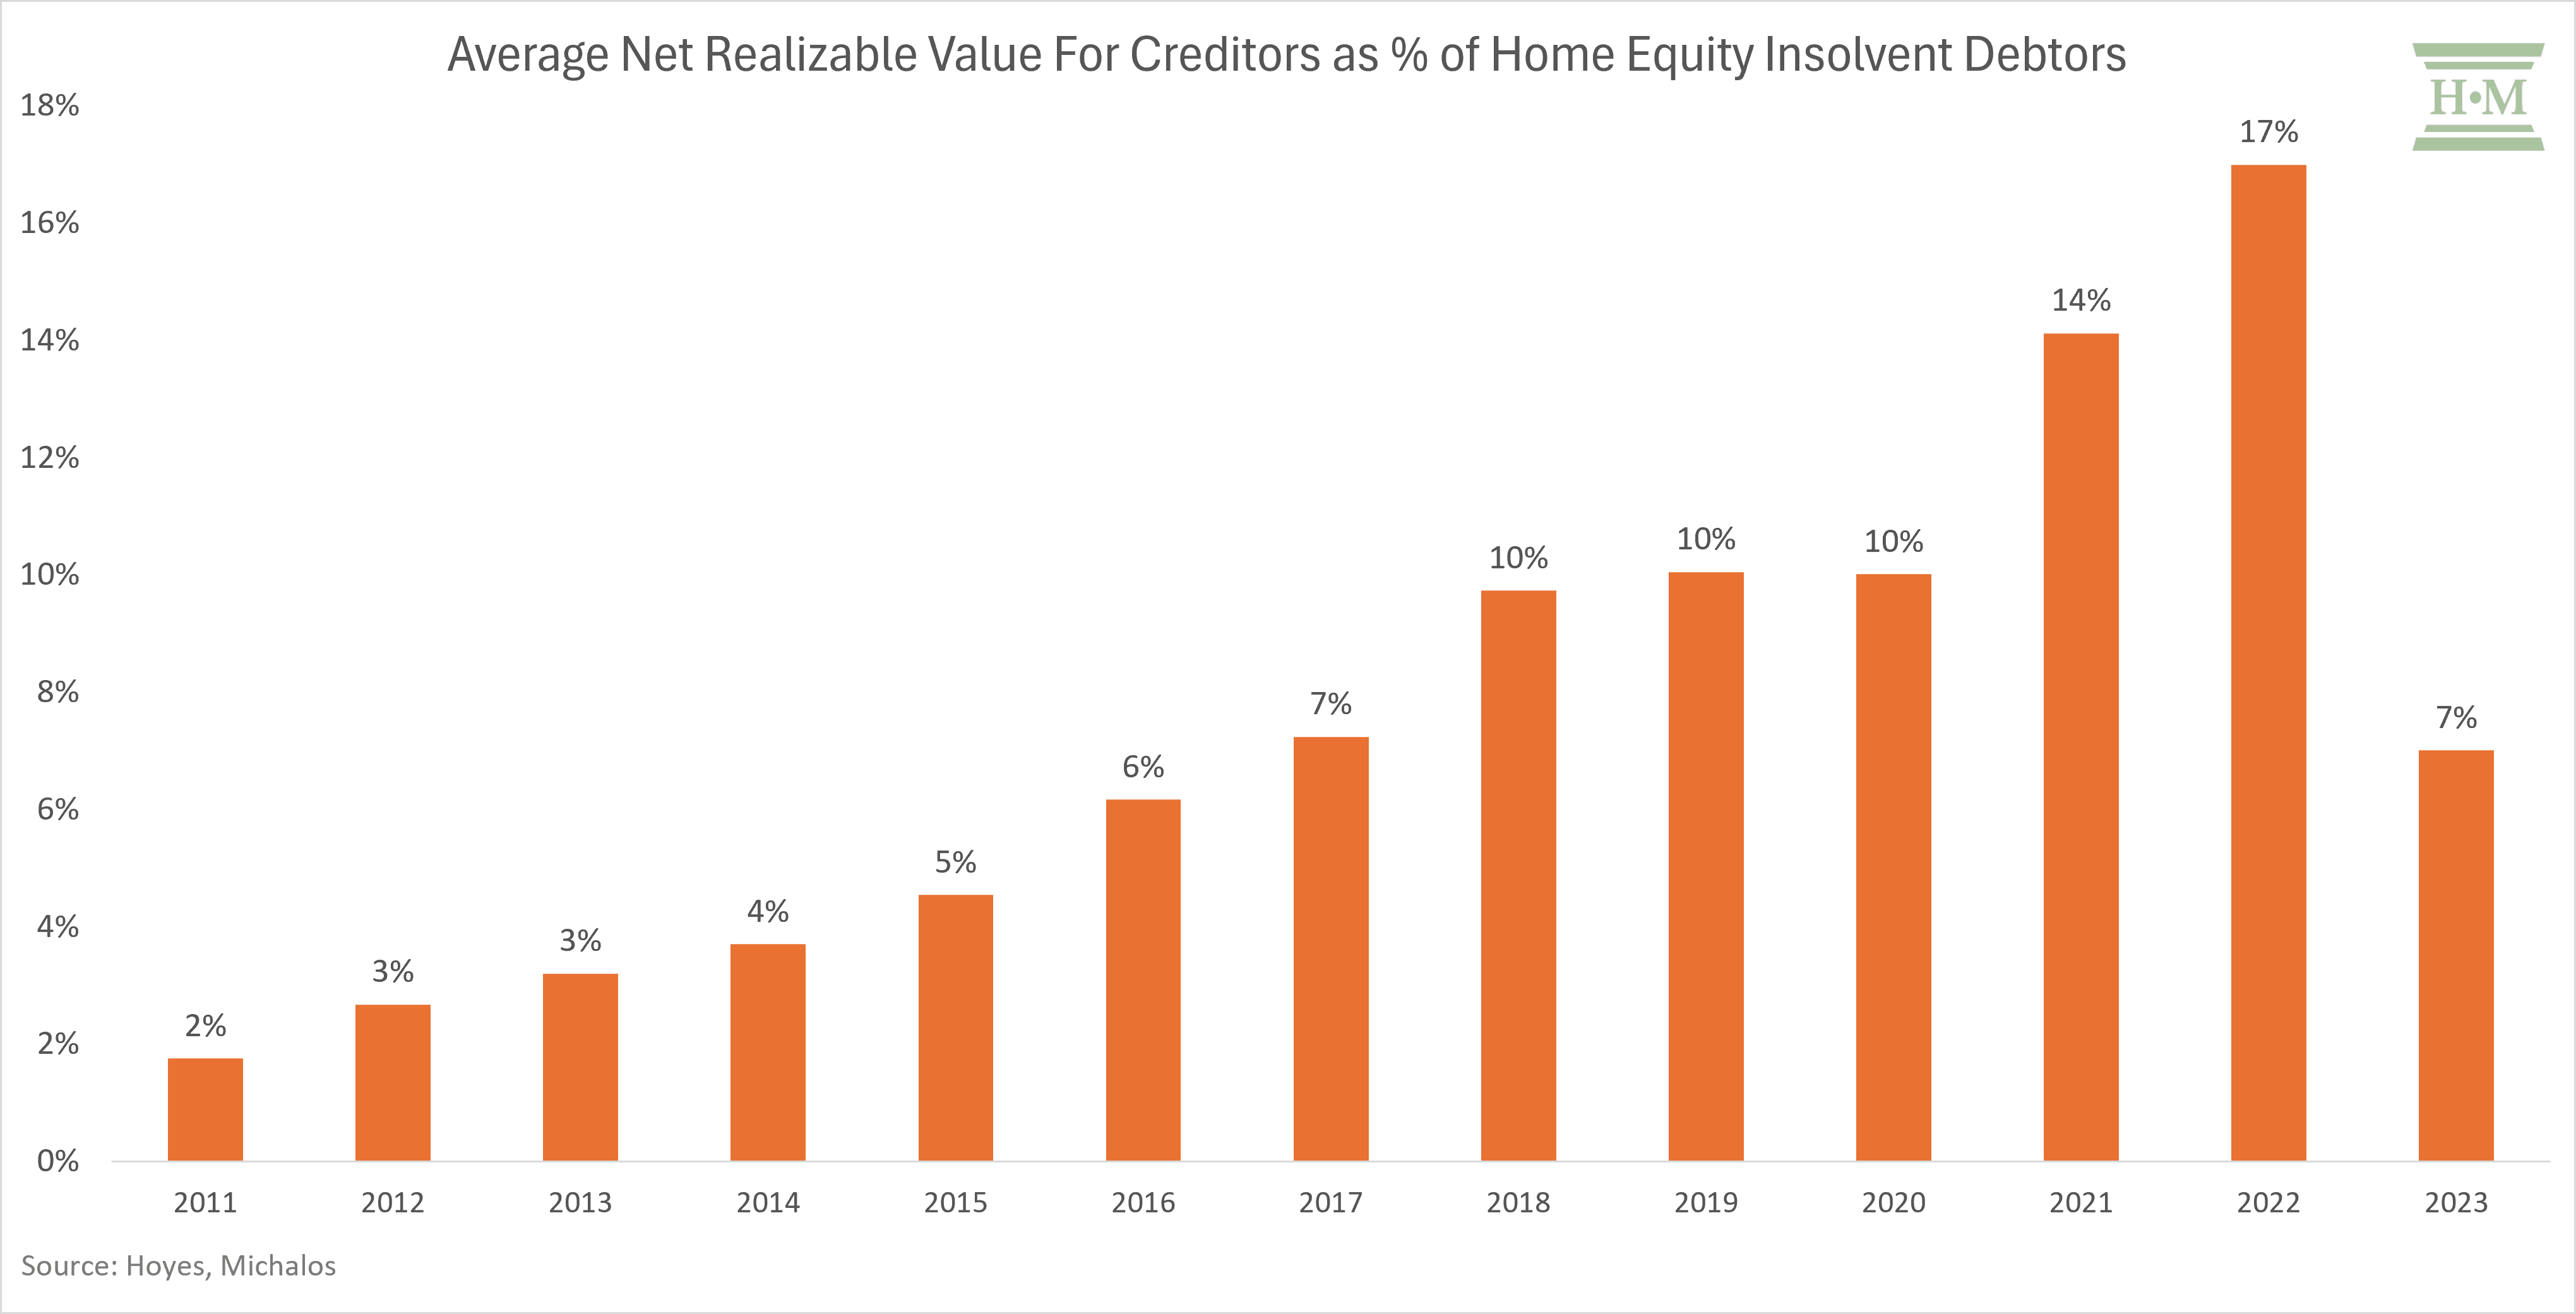
As house prices increased, while homeowner insolvencies declined, the average net realizable value in home equity available to creditors rose. However, we’ve seen a significant drop in net realizable value (as a percentage of home equity) to 7% in 2023, returning to levels not seen since 2017.
When high mortgage indebtedness becomes an insolvency driver, we also see a high percentage of negative home equity among insolvency homeowners. This rate fell to 0% in 2022 but has risen rapidly to 10% of all homeowner insolvencies in 2023.
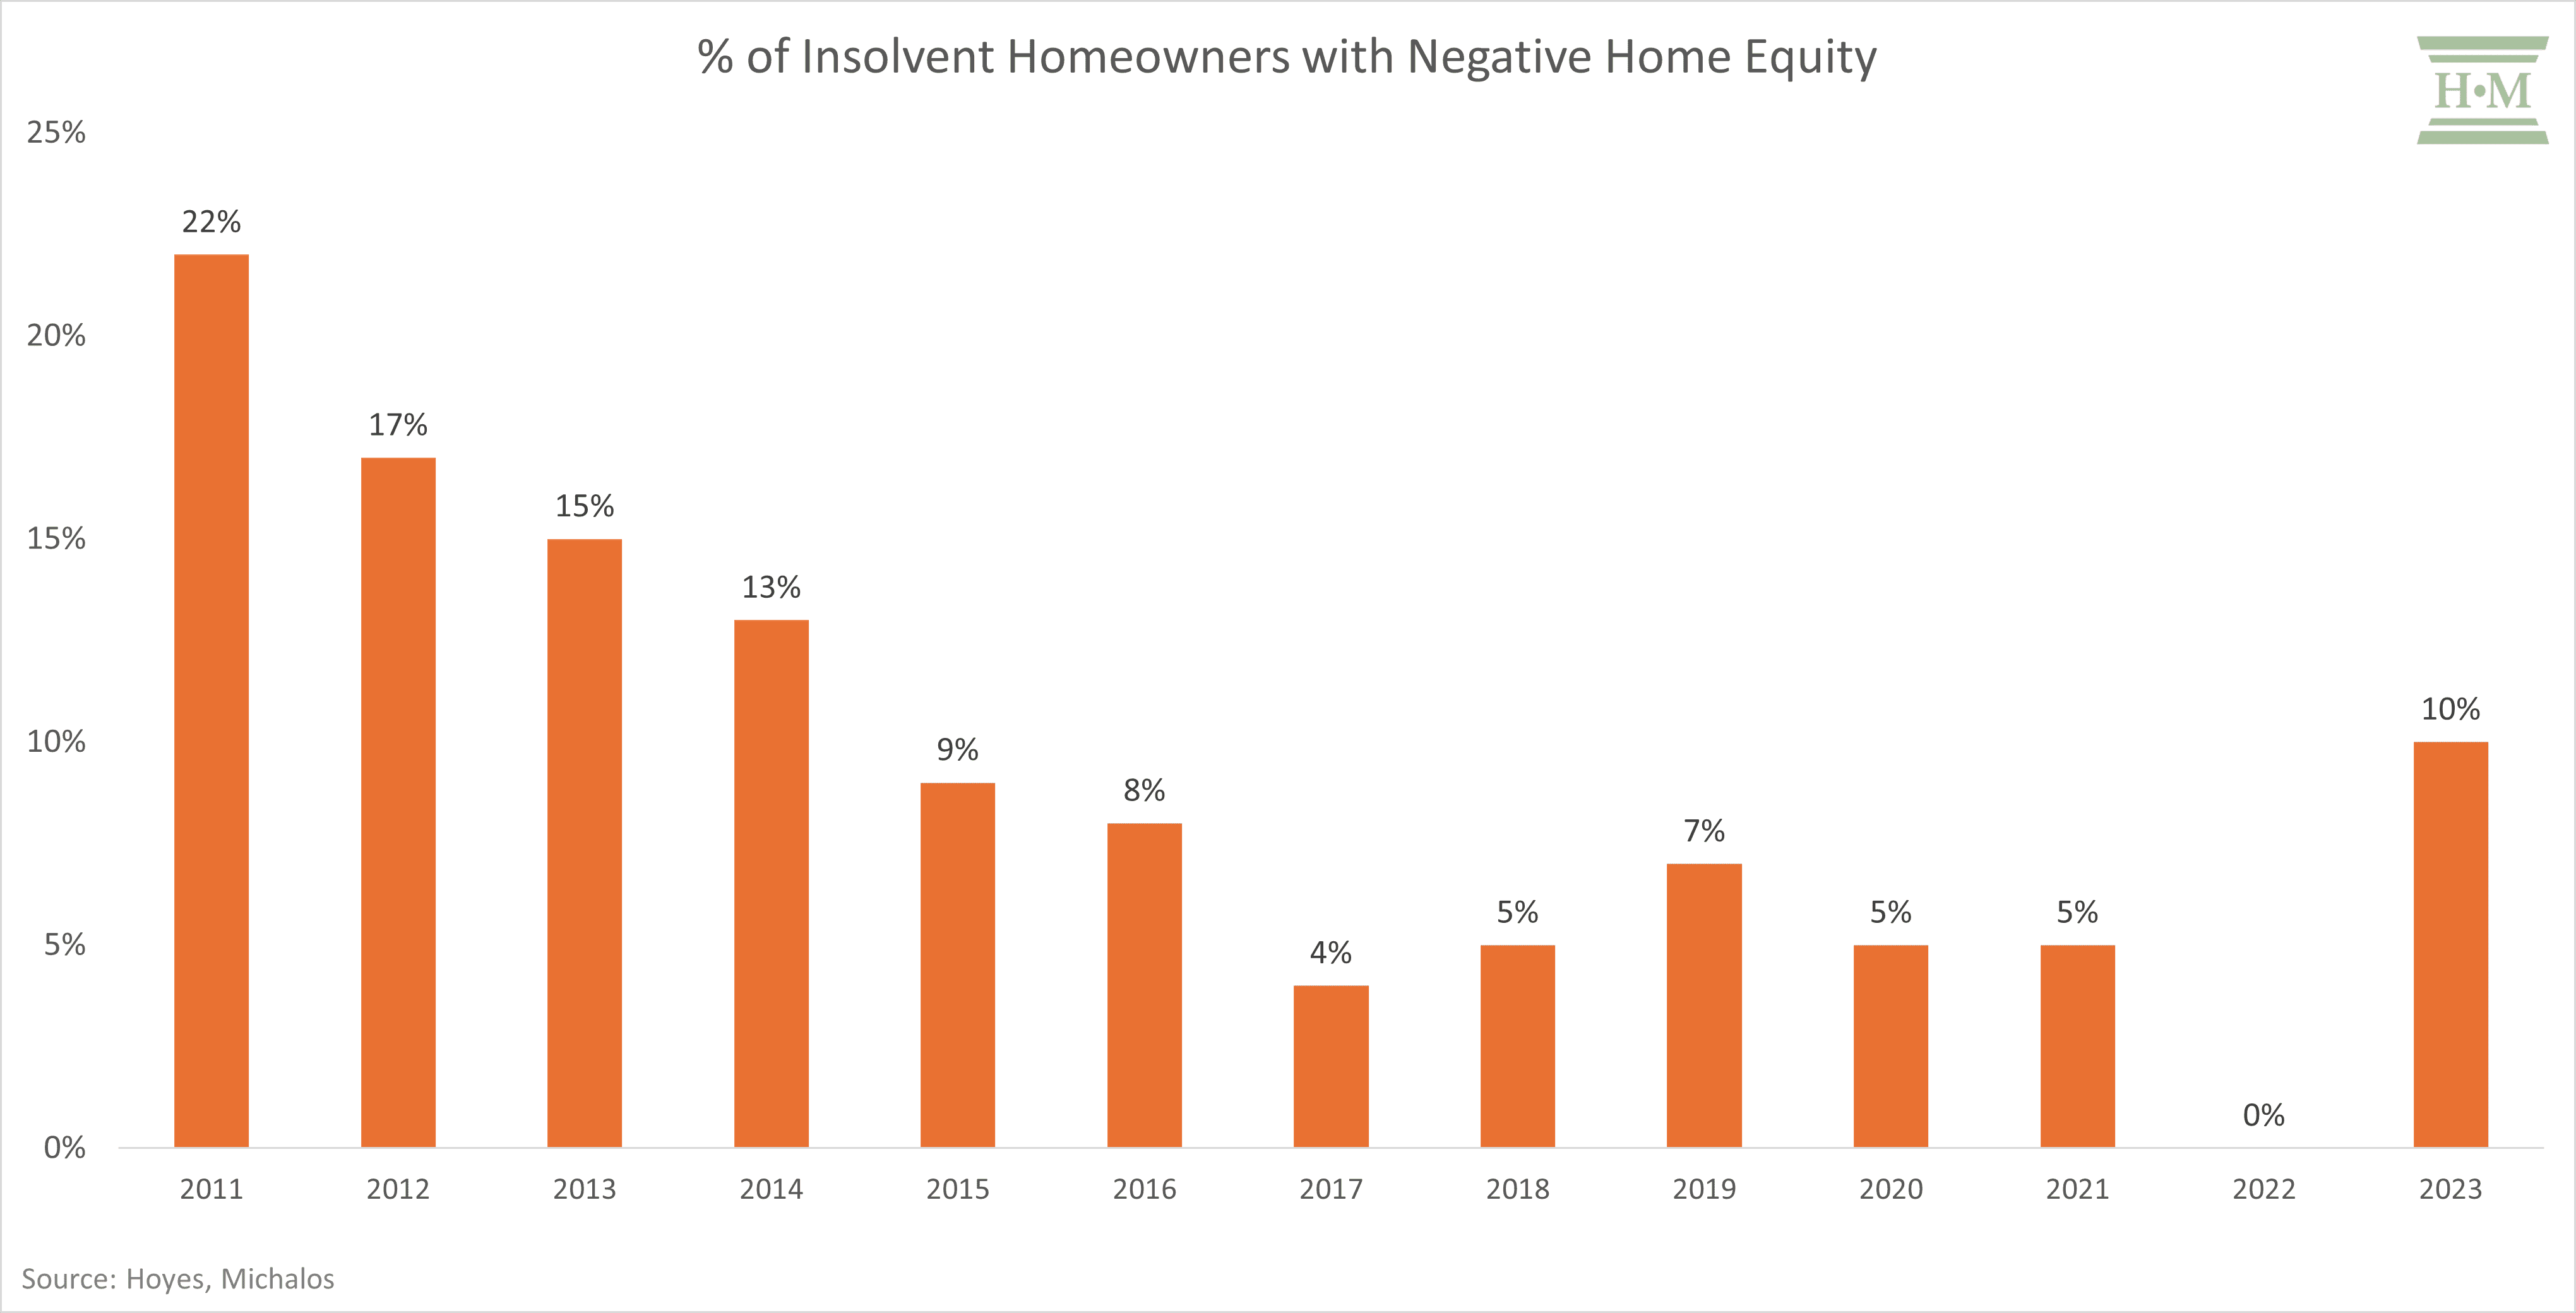
Finally, homeowners filing insolvencies are much more likely to file a consumer proposal as a way to keep what home equity they do have.
So, what we know is that homeowner insolvencies were in freefall while interest rates were low, mortgage payments were low, and housing prices were on the rise. Consumer credit was still increasing, but homeowners could generally access the equity in their homes to refinance. That trend is shifting, but the question is, how much?
Housing Market Trends – How Will They Affect Vulnerable Homeowners?
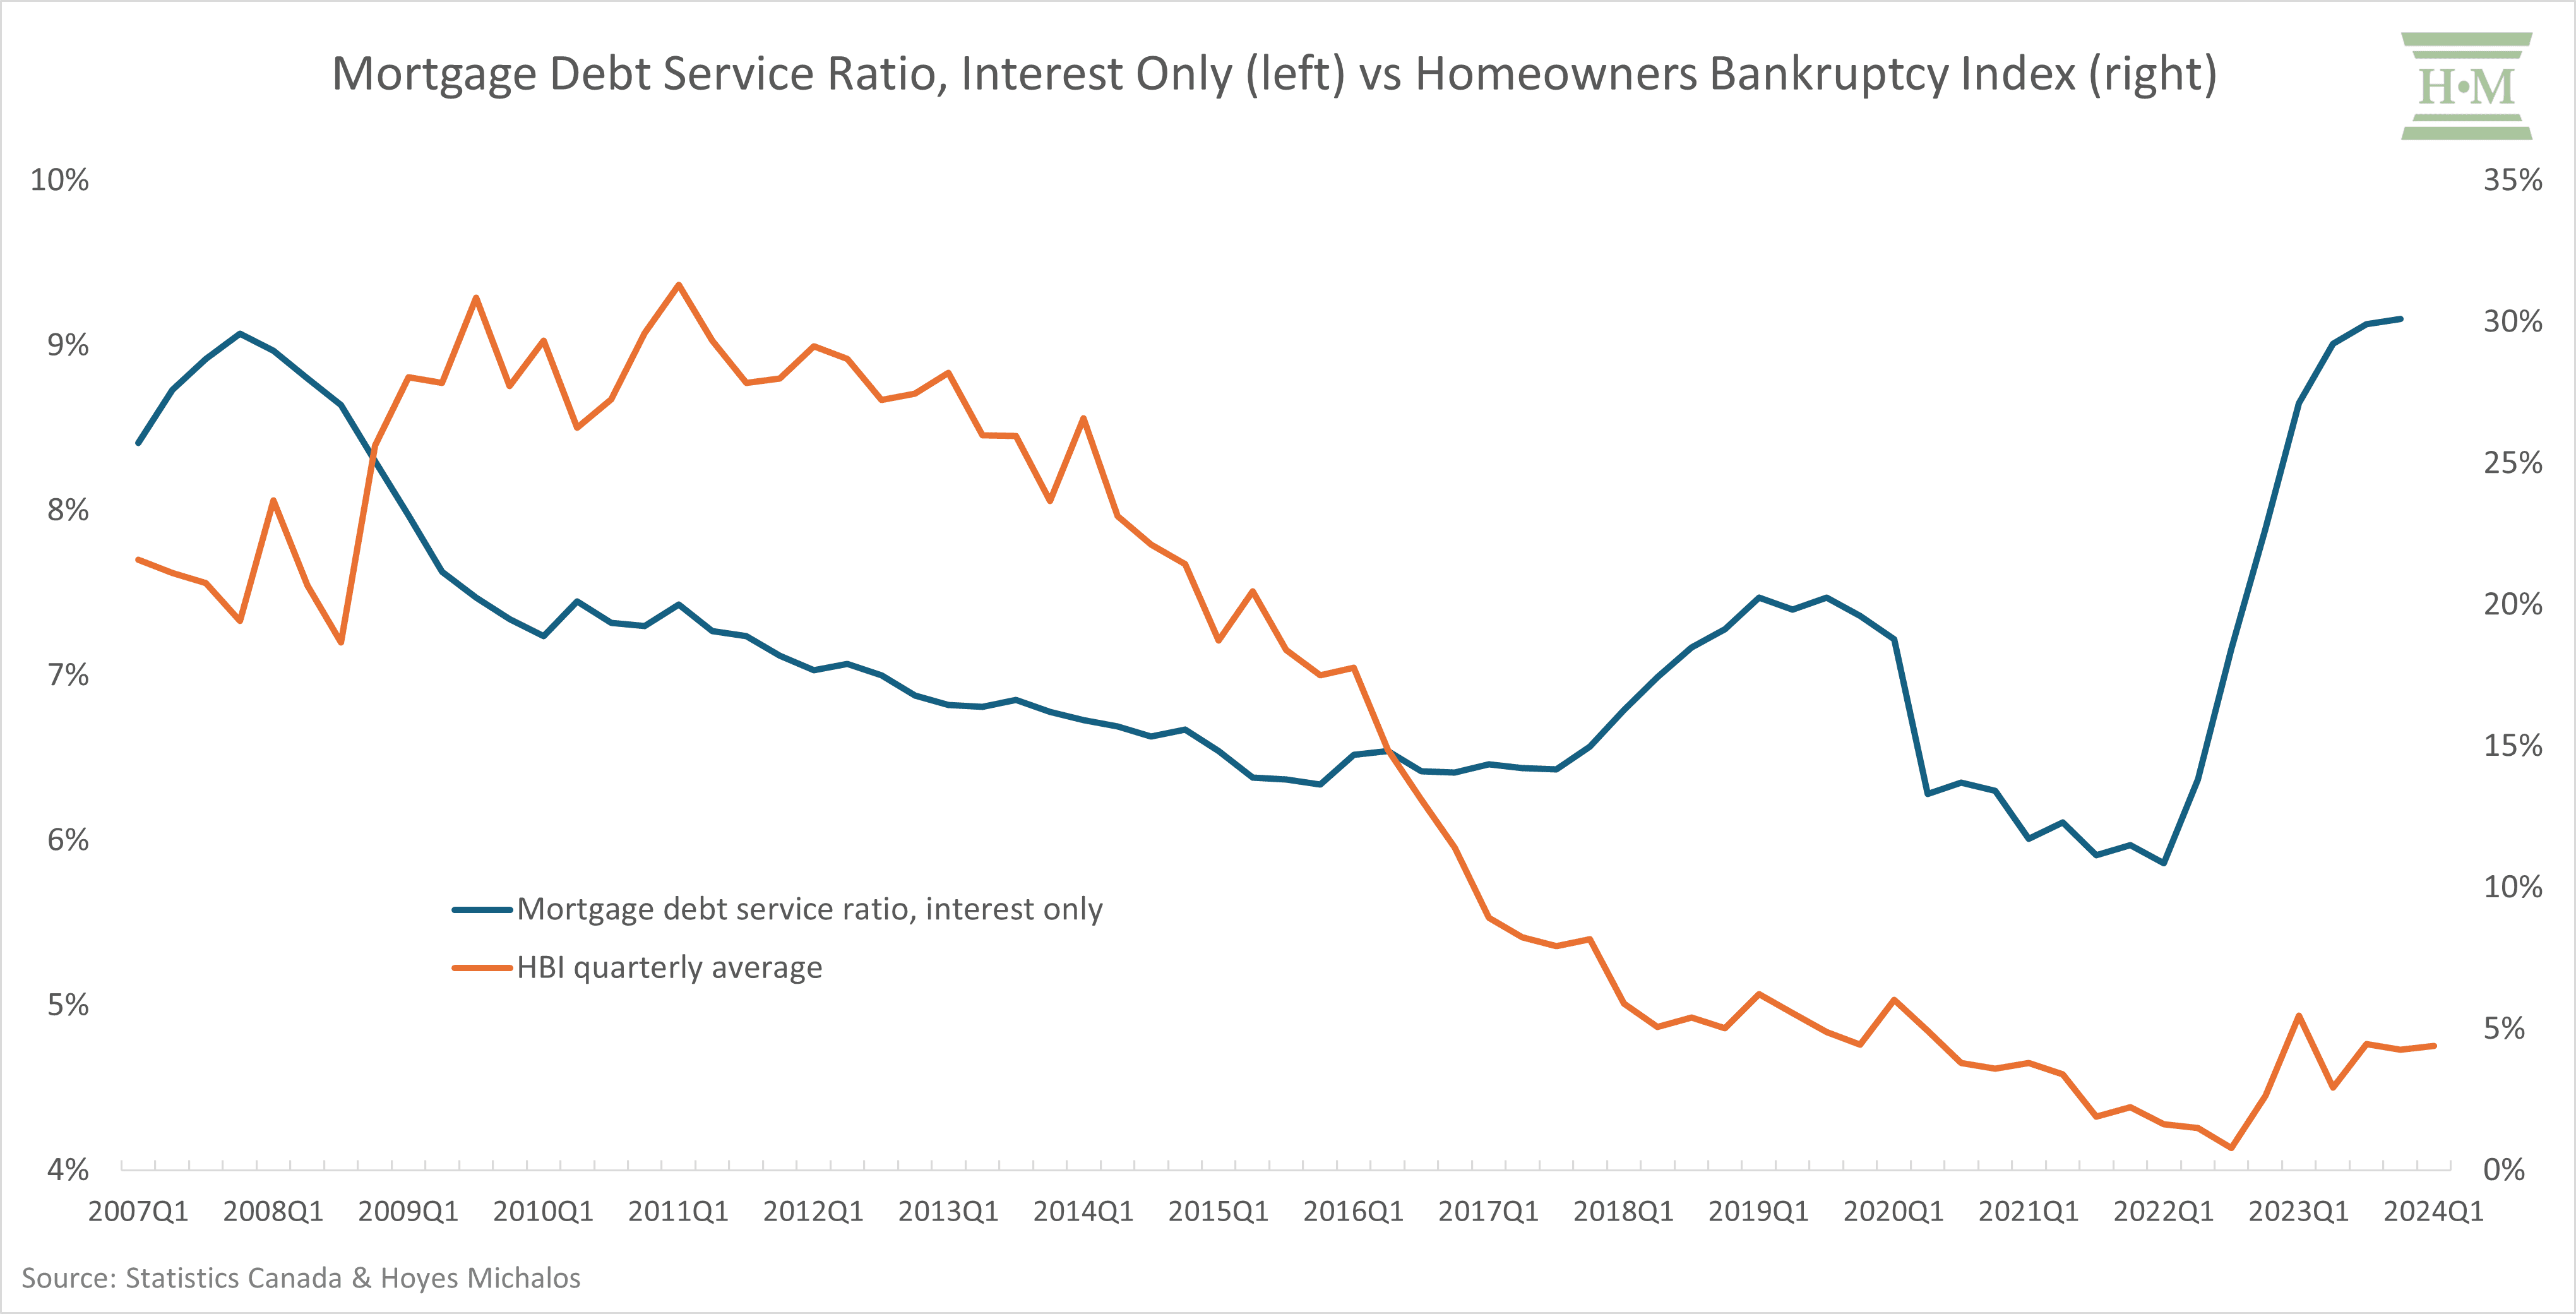
Debt servicing costs are up, and we are unlikely to see any significant relief until mid-2024.
We can see a slight correlation between the impact of mortgage rates and debt servicing costs on homeowner insolvencies. However, interest rate changes need to be sustained to have a long-term impact. Additionally, the impact of rate increases is lagged a year or more. This is why homeowner insolvencies have only risen slightly despite a sharp increase in debt servicing costs in 2023.
The reason for this lag? As mentioned earlier, homeowners will do anything to keep up with rising mortgage payments including taking on increased consumer debt. It is only after their access to additional credit runs out that mortgage delinquencies rise, followed by homeowner insolvencies. The lag between mortgage delinquencies and homeowner insolvencies is much shorter.
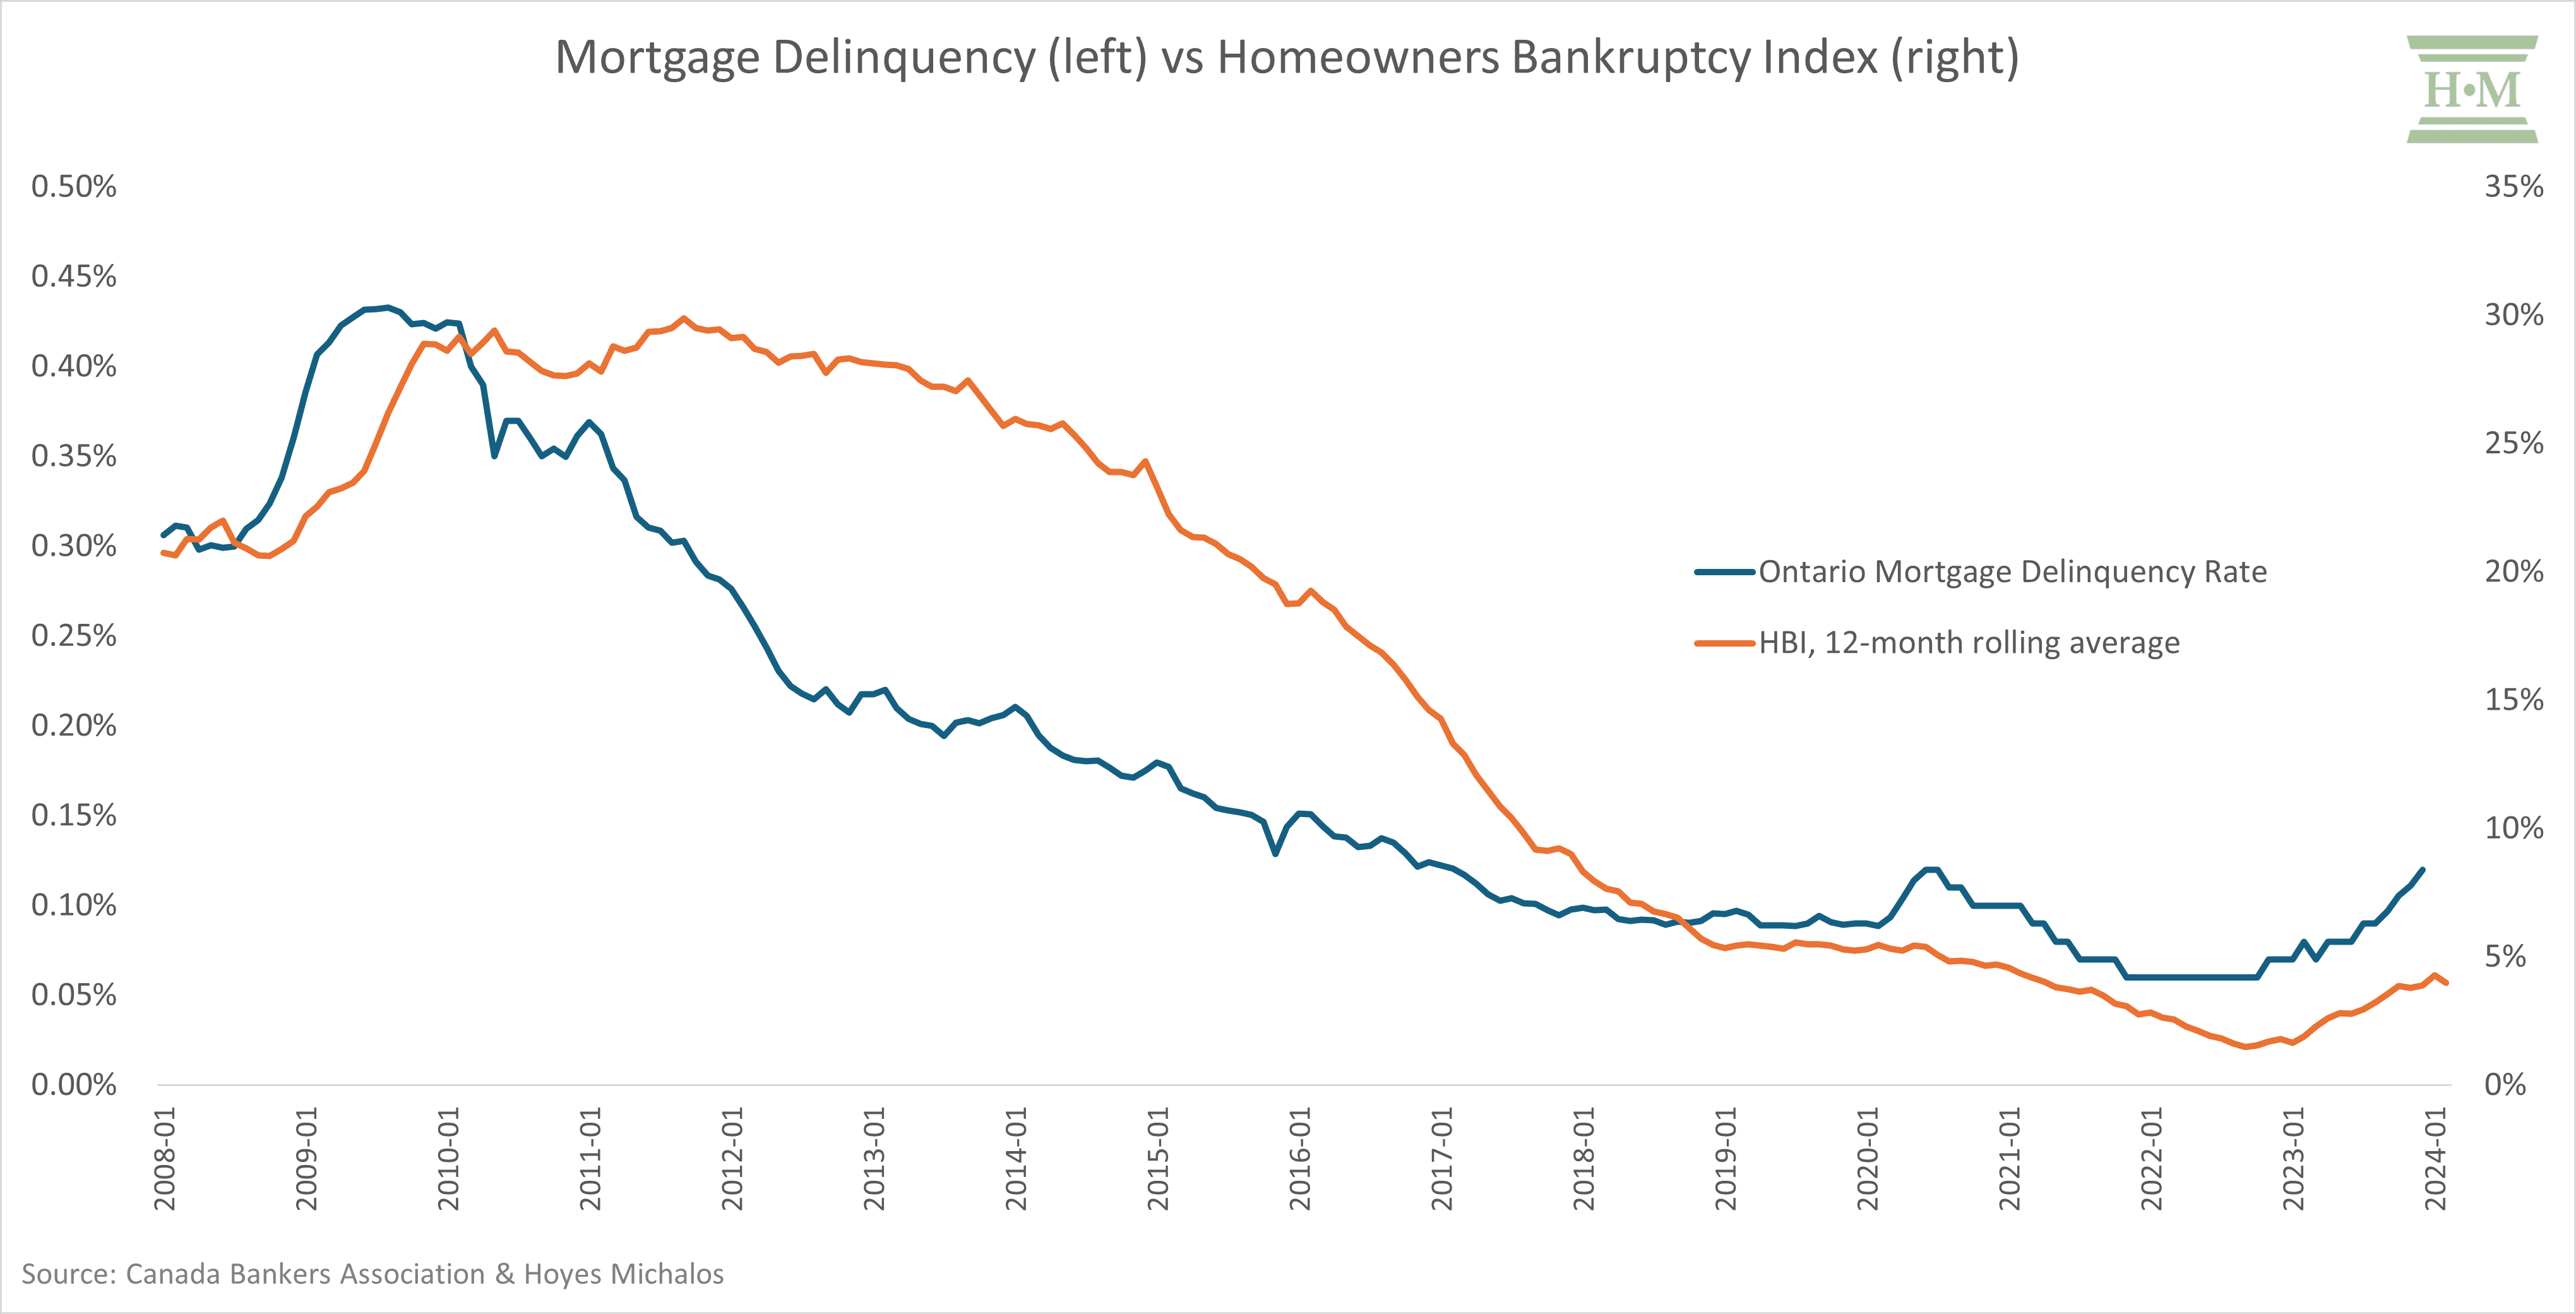
According to the Canada Bankers Association, mortgage delinquencies are already rising, coinciding with the uptick in homeowner insolvencies we are currently experiencing.
The final question mark is what will home prices do?
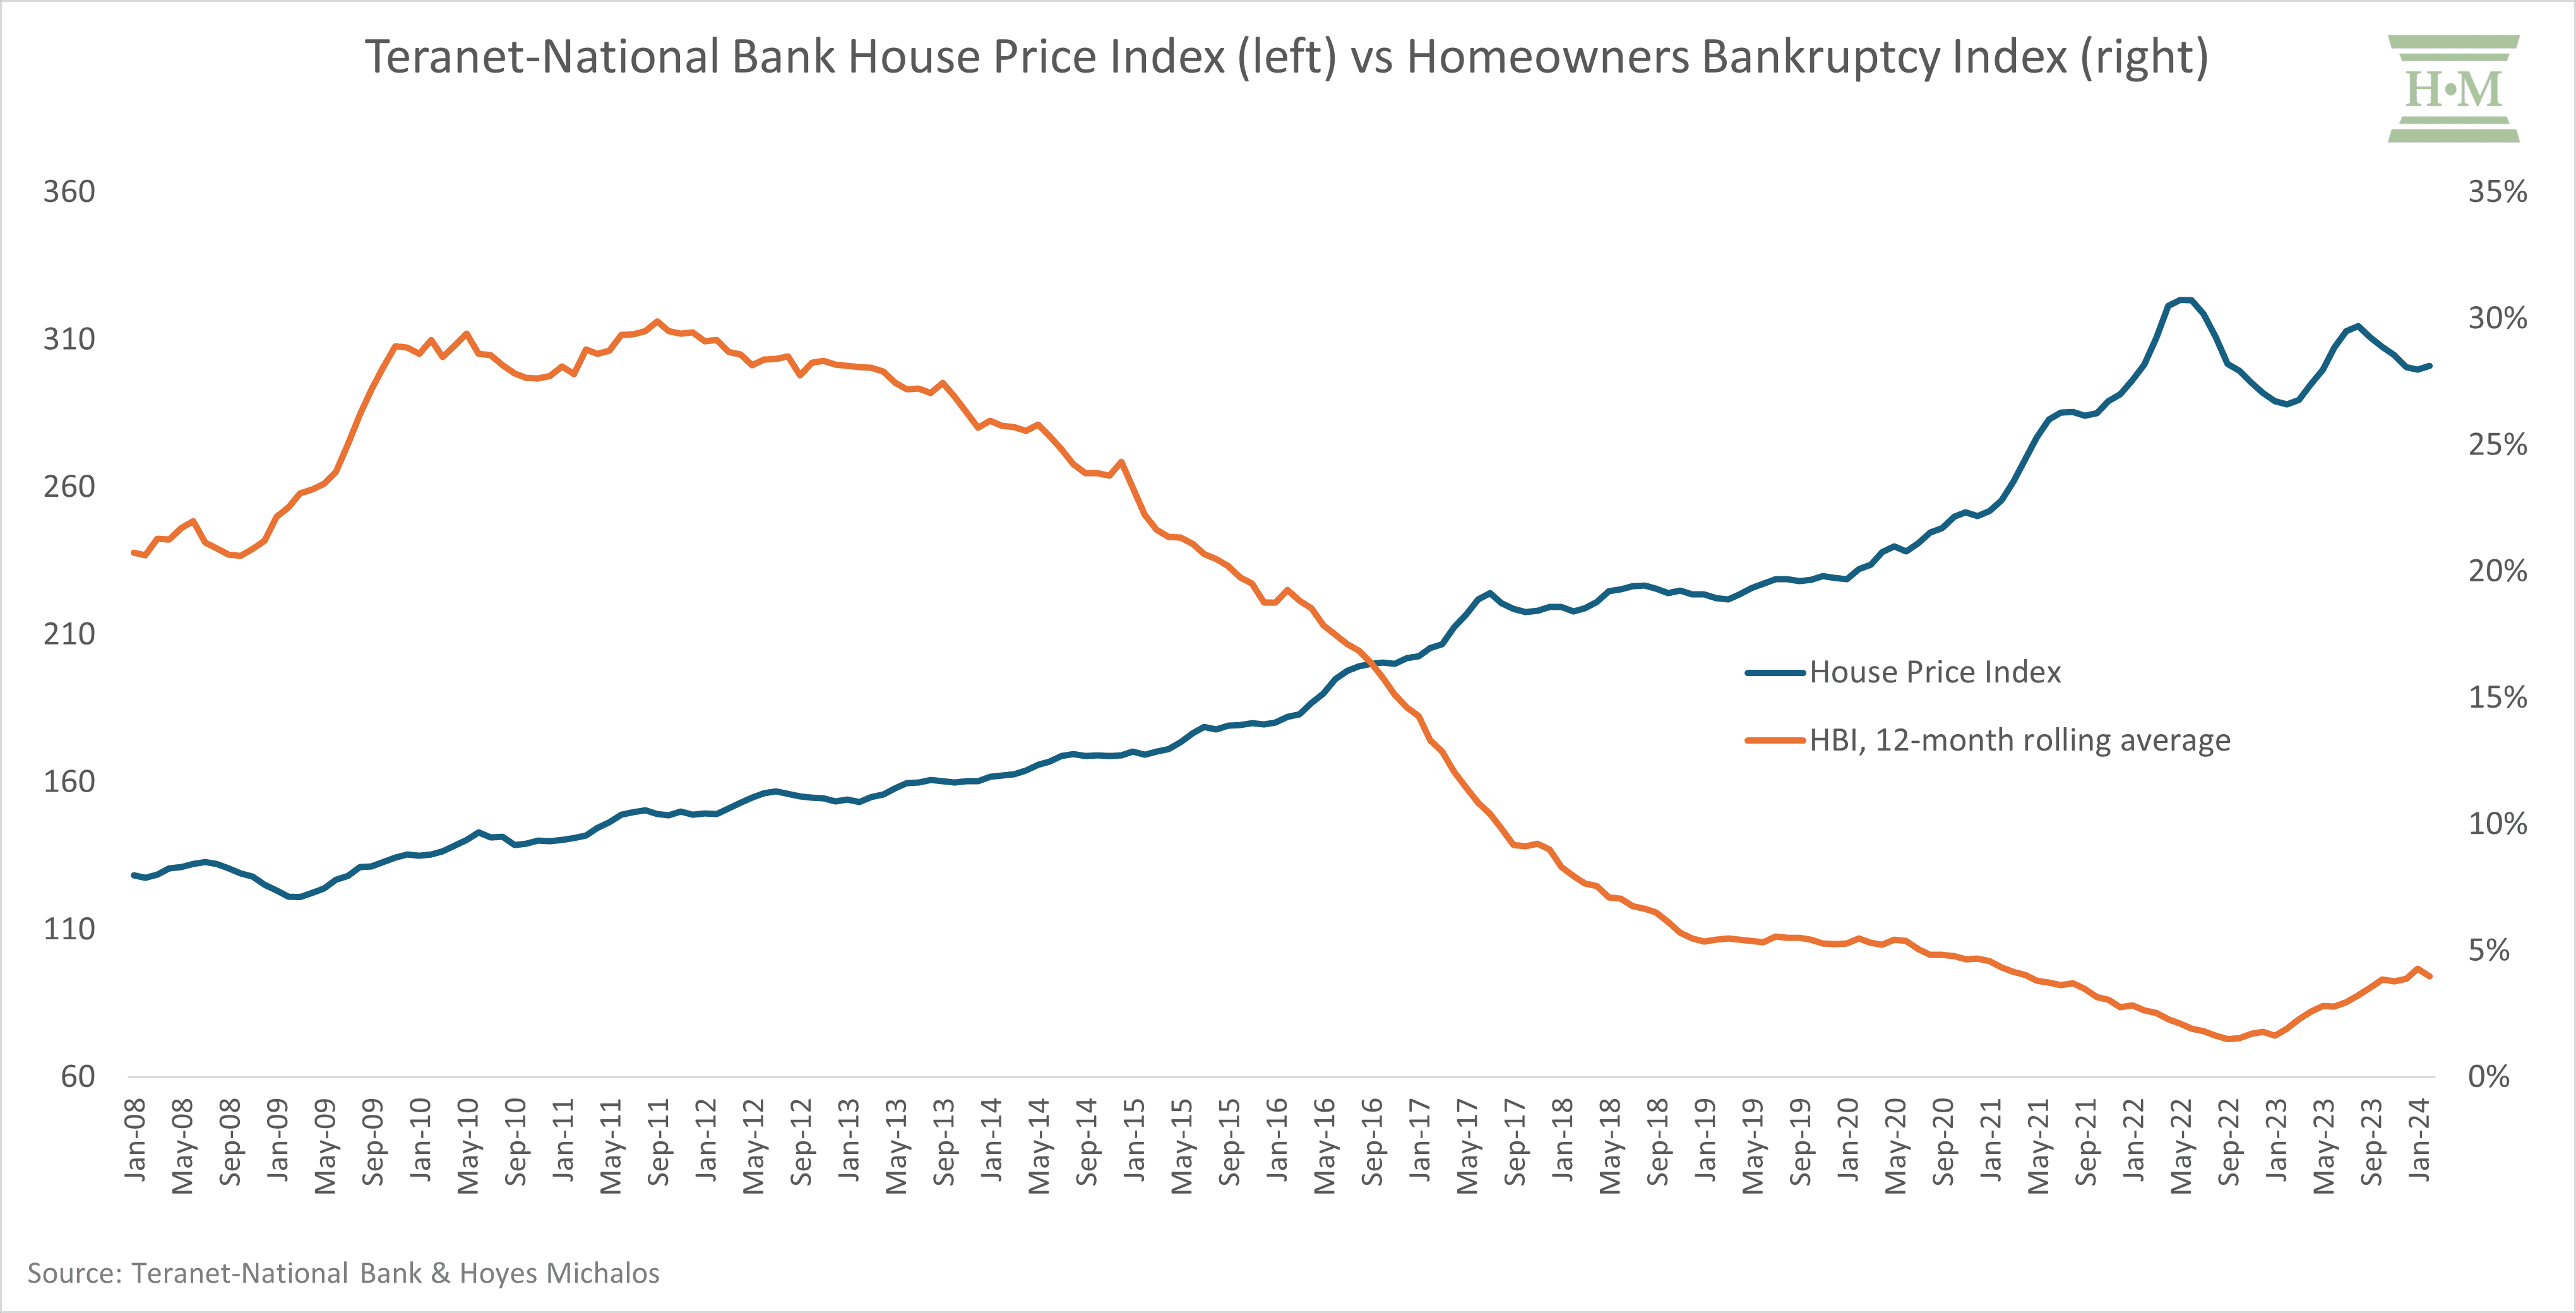
Housing prices have fallen since 2022, and we’ve begun to see a modest uptick in homeowner insolvencies, although levels are not anywhere near historic norms.
As mentioned earlier, what we have seen is a return to overall negative equity in homeowner insolvencies. In these cases, homeowners are more likely to walk away from their homes, abandoning an underwater mortgage, and including any shortfall in their consumer proposal or bankruptcy.
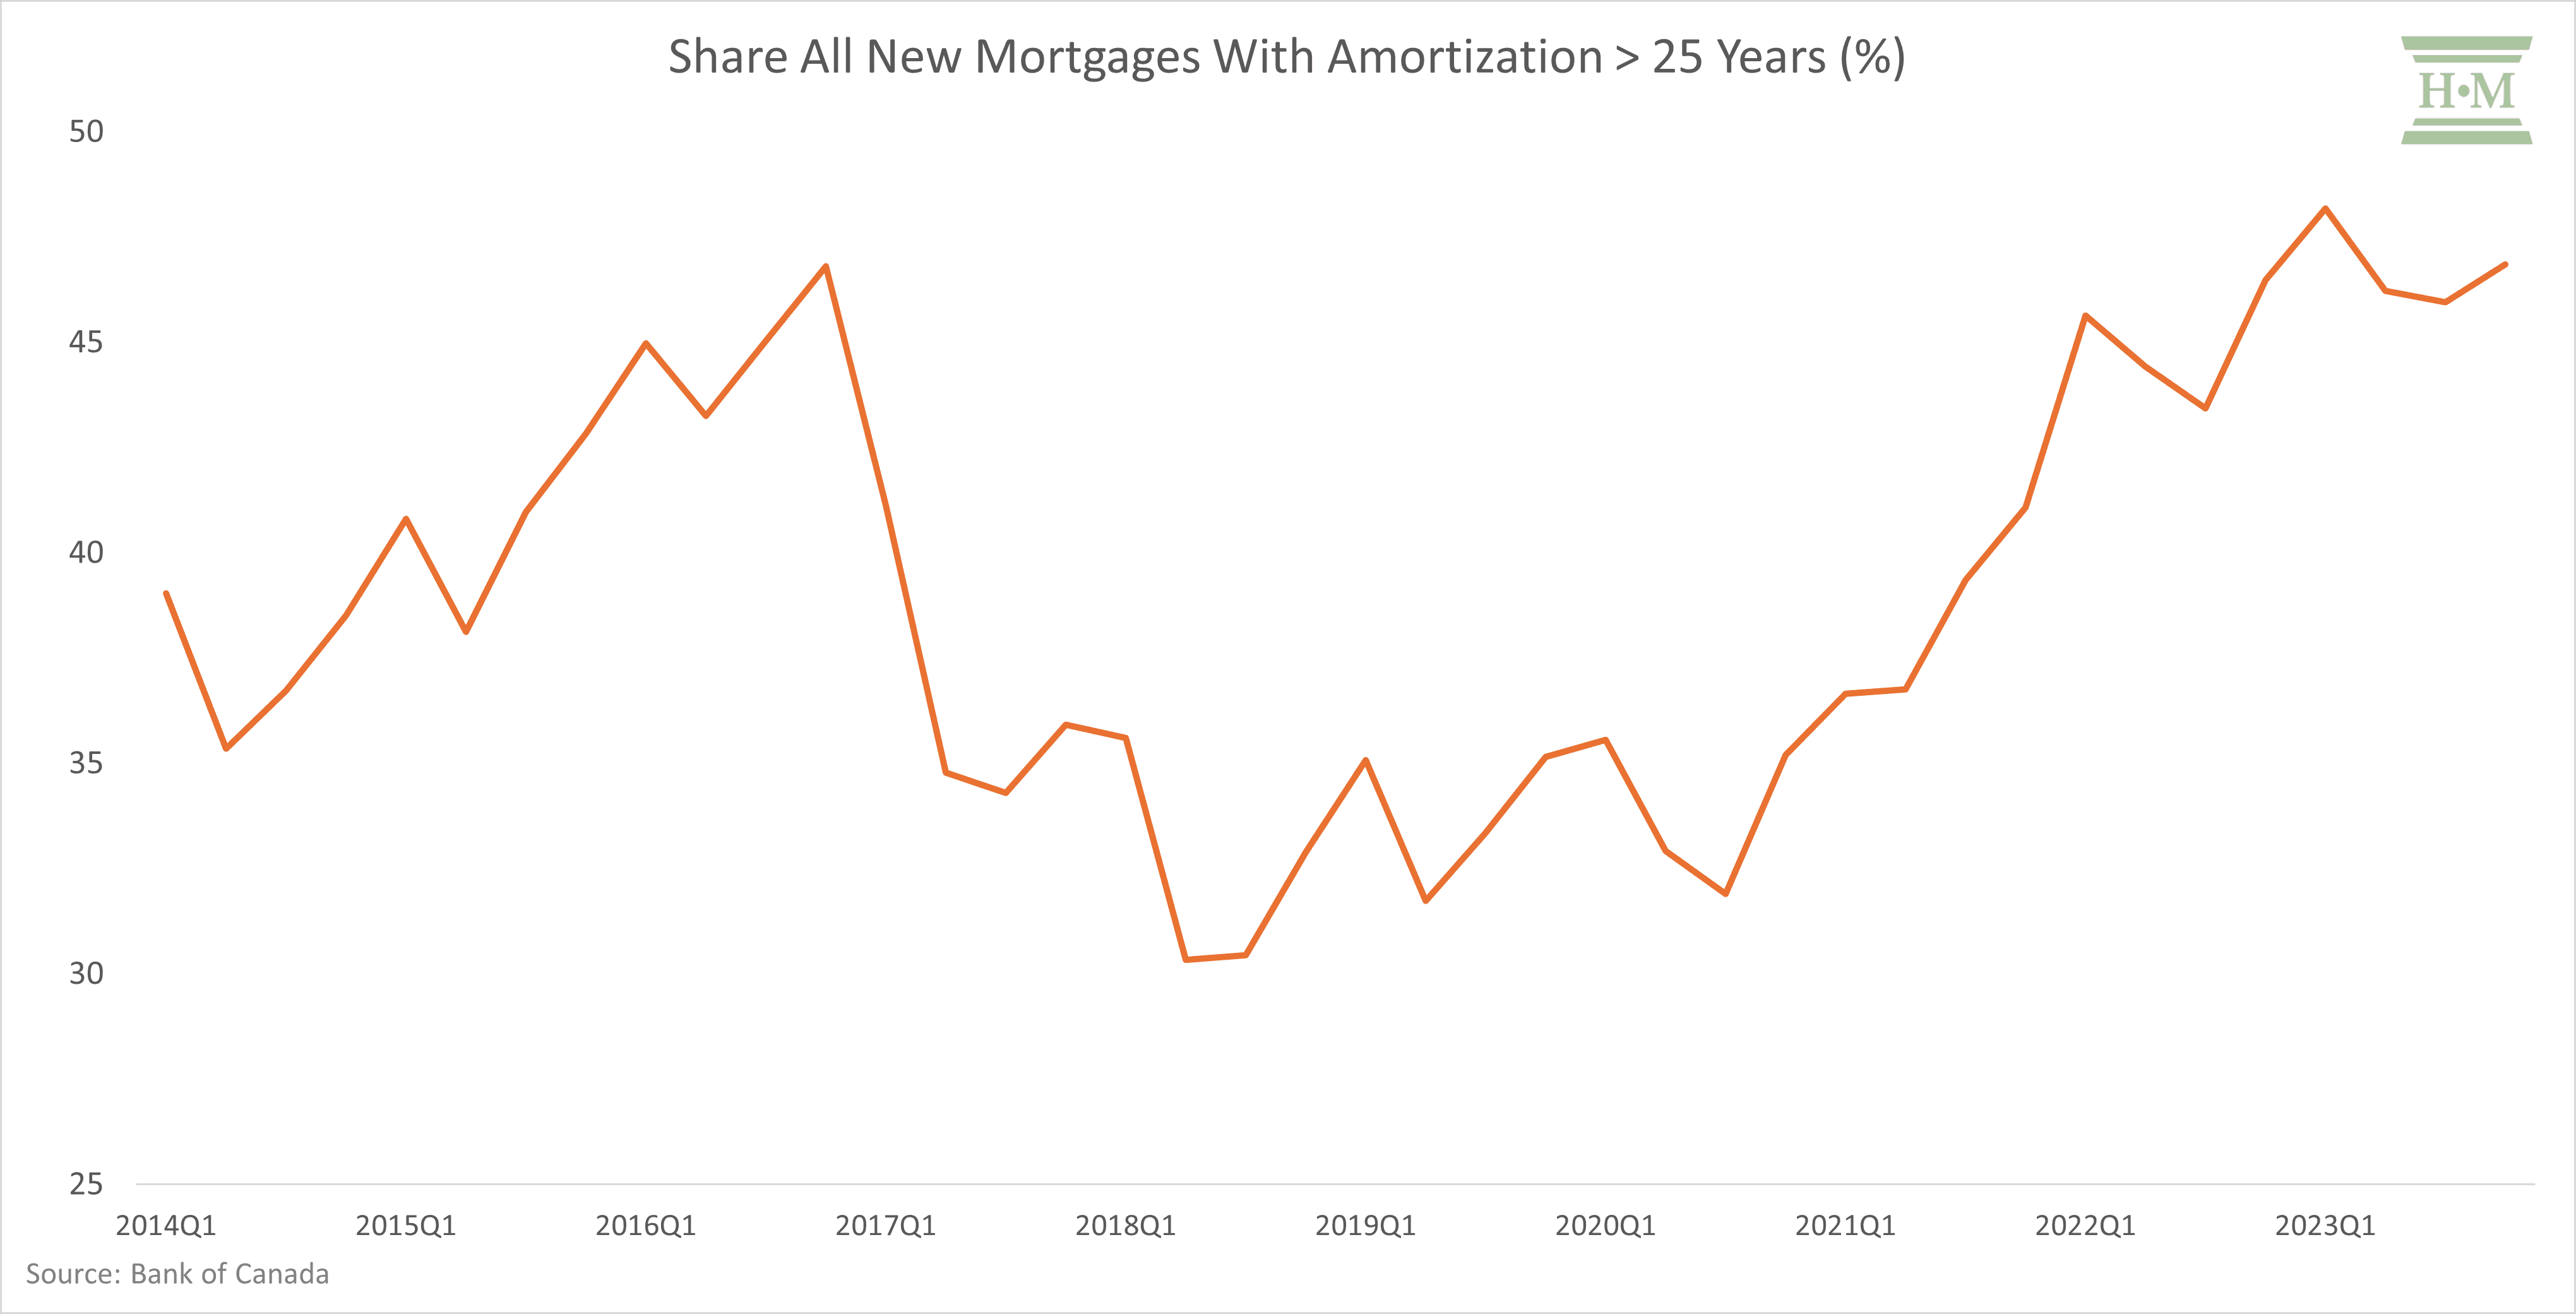
A number we continue to monitor is the share of all new mortgages with an amortization greater than 25 years. This is an indicator of the health of homeowner’s equity in a stagnant or declining price market among recent new home buyers. This number remains elevated at 47% of all new home purchases at the end of 2023.
So, in summary, we expect to see a rise in homeowner insolvencies in the next 12 to 18 months. Even homeowners who are not in trouble today may be soon. Without a corresponding increase in home equity, rising consumer debt among homeowners will lead to more homeowner insolvencies.
However, how much they will rise is uncertain and will depend largely on the housing market.