
Consumer insolvencies in Canada are going up. Rapidly.
Naturally, this is puzzling a lot of financial analysts and the media. Why would more Canadians be filing for bankruptcy when we have low interest rates, low unemployment, and rising wages? Shouldn’t we be OK?
The reality is gains in the economy are no longer enough to allow heavily indebted consumers to avoid or outrun their financial circumstances. The fact that the economy seems to be doing well is not relevant. Joe Debtor is struggling more today than in the last several years.
An increasing percentage of Canadians are reaching a threshold where they can no longer keep things going financially. And the story is more complicated than the simple fact that we are carrying high debt loads.
The current growth in insolvencies is not a blip. It is a precursor of much worse to come.
Let me explain why.
A quick look at the insolvency cycle.
It’s important to understand that there is a time lag between when someone begins to experience severe financial problems and when they file for insolvency. Someone with debt will do anything to maintain their access to credit because that is how they have been surviving until now. The cycle ends when they admit they can no longer kick the can down the road.
Yes, economic conditions accelerate the insolvency cycle. When the 2008 recession hit, we saw a big rise in insolvency filings between 2009 and 2010.
But why are insolvencies up now? We haven’t had a recession yet…
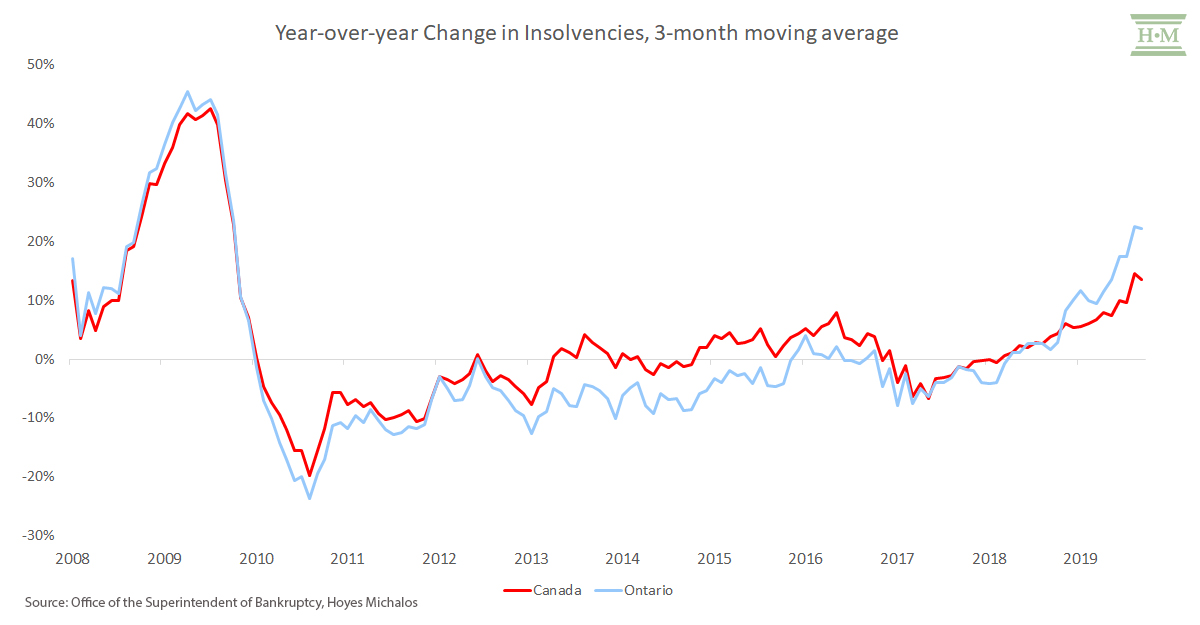
Since April 2018, we’ve seen a steady rise in the number of insolvency filings in Ontario and across Canada and the rate of growth is accelerating. Canadian insolvencies are on pace to grow at a rate of around 10% this year, while Ontario insolvencies are likely to be up above 16%.
For several years, Canadian households have been able to handle a rising level of consumer credit. It is apparent that an increasing number of Canadians no longer have the financial capacity to do so.
Between October 2018 and October 2019, roughly, 5,700 more Ontarians and 11,100 more Canadians reached their financial limit than the previous 12-month period.
Why do I state that increase in terms of real numbers rather than percentages? Because insolvencies deal with real people. It is their personal circumstances that dictate whether they need to file insolvency. And it is their personal circumstances that explain why insolvencies have risen so much when our overall economy is doing so well.
It’s an income-expense issue
While there hasn’t been a recession to accelerate insolvency filings, what we have seen in the last two years is a different pressure: a disproportionately large increase in those who can no longer balance their budget with debt.
Yes, employment rates have been stable. Unemployment is not relevant to insolvencies right now. Historically, 8 out of 10 people filing insolvency are employed at the time of filing and barring a recession this number is unlikely to change.
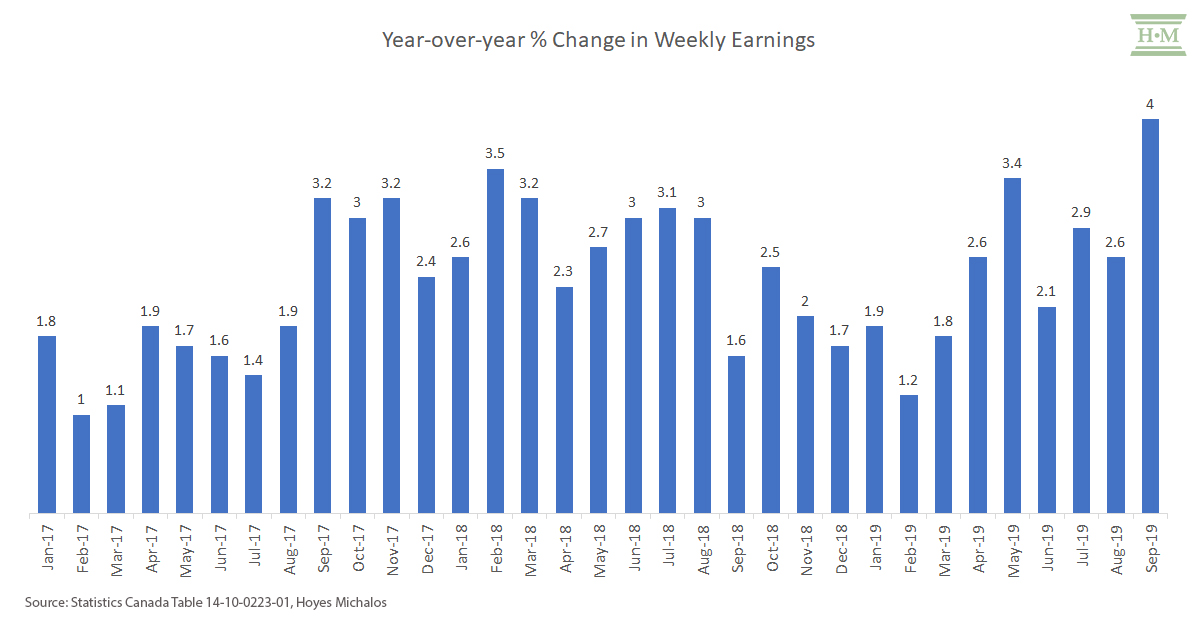
Wages in Canada have increased at an average pace of 2.5% in the first nine months of 2019. Yet this has not been enough for a growing portion of the working population to keep up with every-day living costs and debt repayment. An increasing percentage of Canadians with unsecured debt are reaching the breaking point.
This time around, financial distress isn’t due to a loss of income, but rather a shortage of income to cover expenses and debt repayment.
For an increasing number, the heavy debt loads and continuous borrowing they have maintained for several years now has reached the point of being unsustainable. Access to more credit to delay insolvency is no longer an option.
Day-to-day living expenses outstrip inflation, and wages.
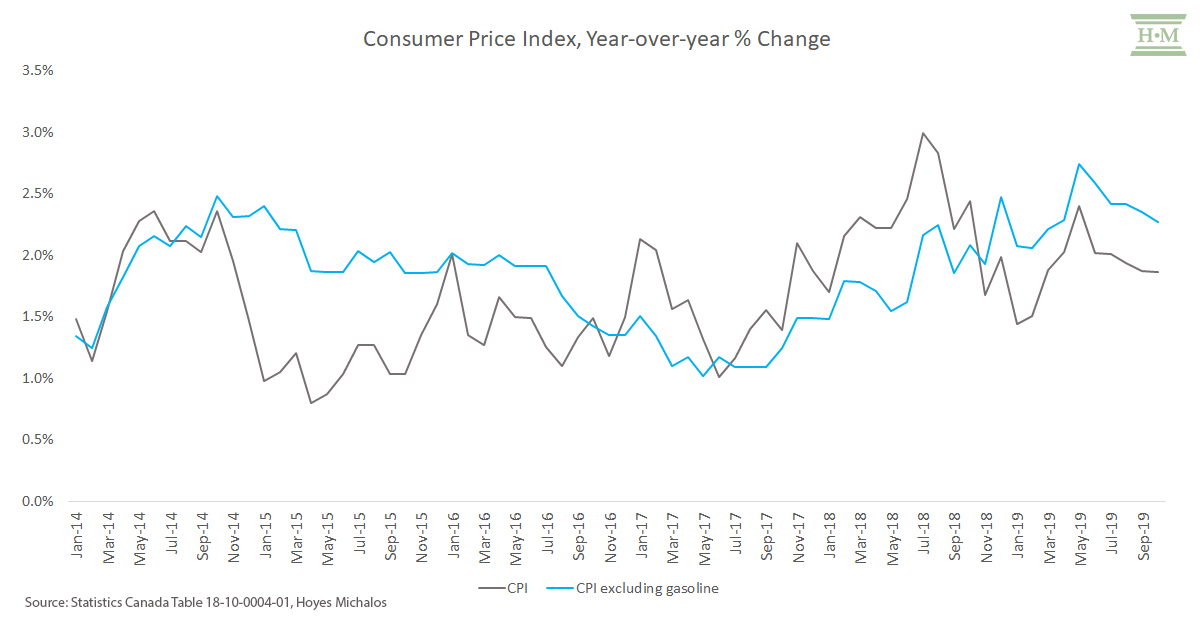
Excluding gasoline, CPI growth has accelerated throughout much of 2018 and 2019. Year-over-year growth has averaged 2.3% in the first 10 months of 2019 compared to 1.9% for all of 2018.
Rising food costs means less money for other expenses and debt repayment
Our average client spends 31% of their net monthly household income on personal and living expenses, which includes food. Rising food prices have an immediate and detrimental impact on someone living paycheque to paycheque while trying to repay debt.
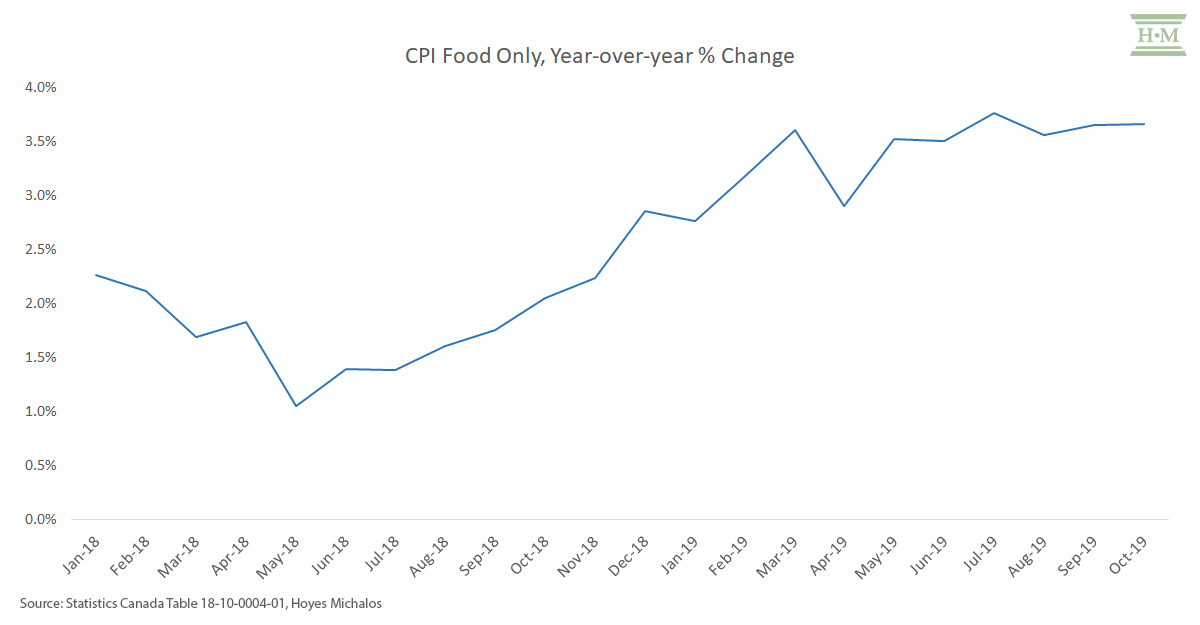
The cost of food has increased 3.4% in the first 10 months of 2019, up from a rise of 1.9% in 2018. This is money that can no longer go towards servicing debt.
Housing, particularly rental rates having an impact
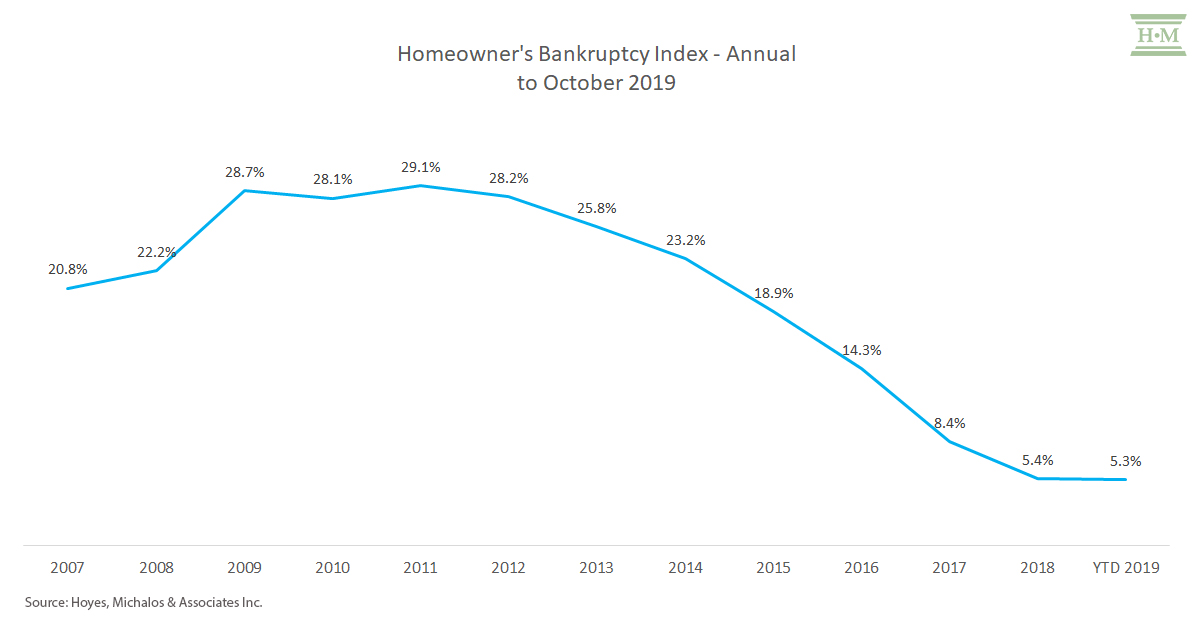
Our average client spends 40% of their monthly net income on housing costs. We also know that today, roughly 95% of those filing insolvencies in Ontario are renters.
Data from the Canadian Rental Housing Index confirms that 46% of Ontarians spend more than 30% of their income on rent and utilities and 21% spend more than half of their income on housing costs.
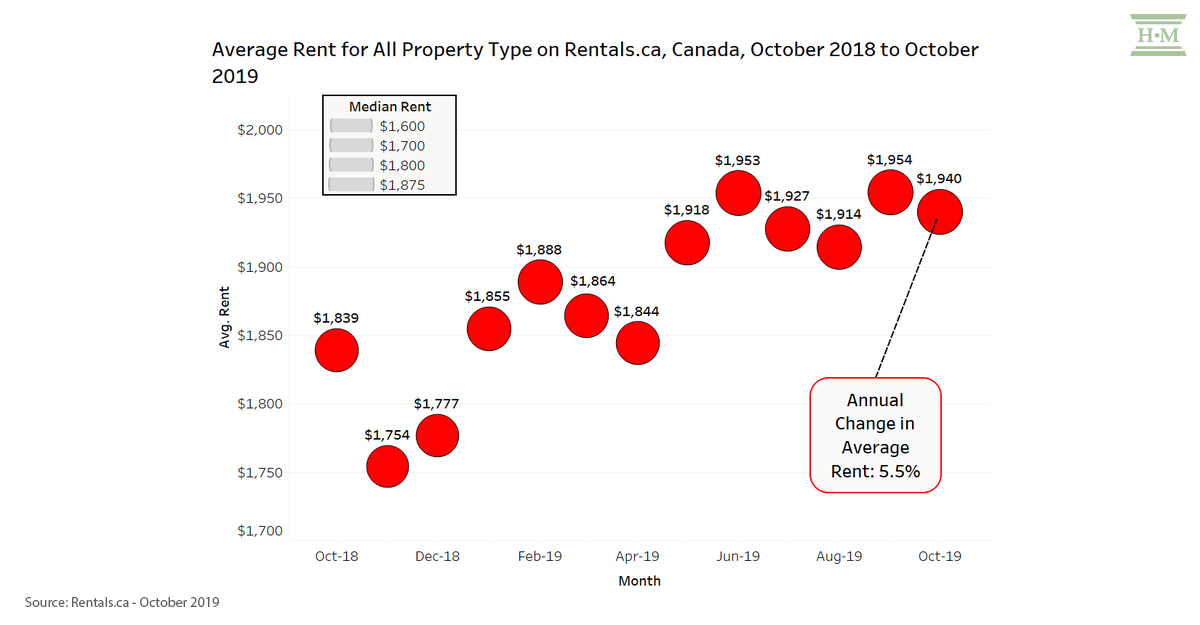
According to Rentals.ca data, the average rent for Canadian properties in October 2019 was $1,940 per month – an annual increase of 5.5%. The median rental rate was $1,850, up 8.9%.
On a provincial level, Ontario had the highest rental rates, with landlords seeking $2,334/month on average across all property types in October 2019, a rise of 9.1% from October 2018.
A rise in housing costs isn’t felt as quickly as a jump in food prices because you don’t move every week or every month. However, we have seen a rise in people filing insolvency as escalating rental costs due to renovictions and new moves consume a bigger chunk of paycheques.
Consumer credit is coming home to roost
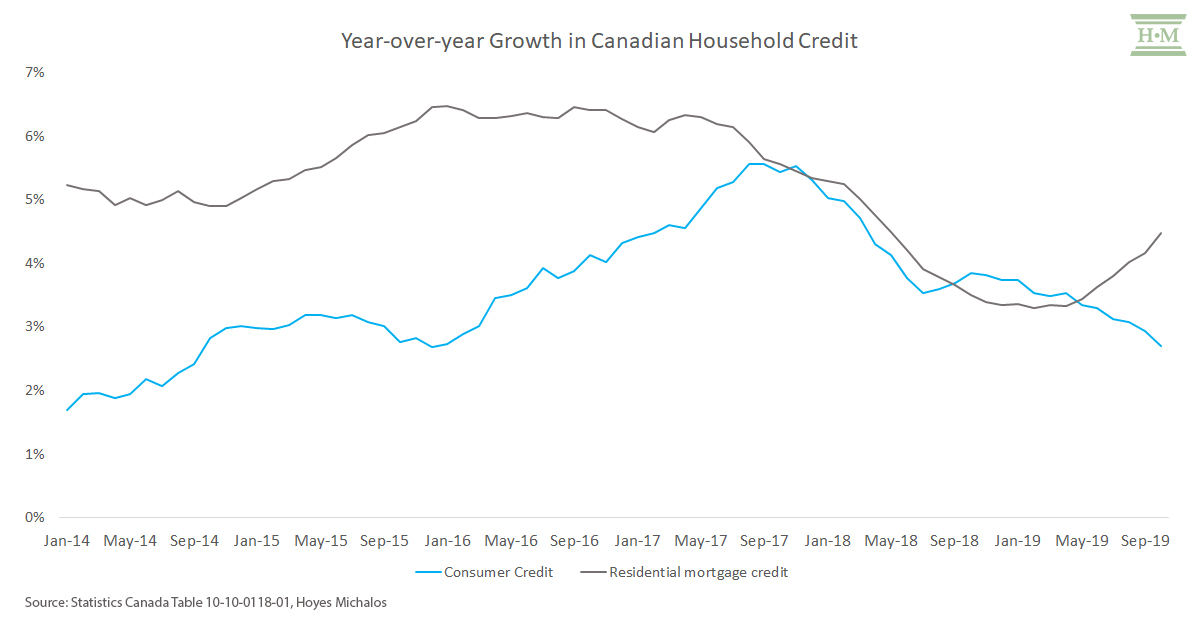
The good news is consumer credit growth has decelerated. In October, consumer credit grew at an annualized rate of 2.7% to $640 billion (unadjusted), down from a peak of 5.6% growth in late 2017.
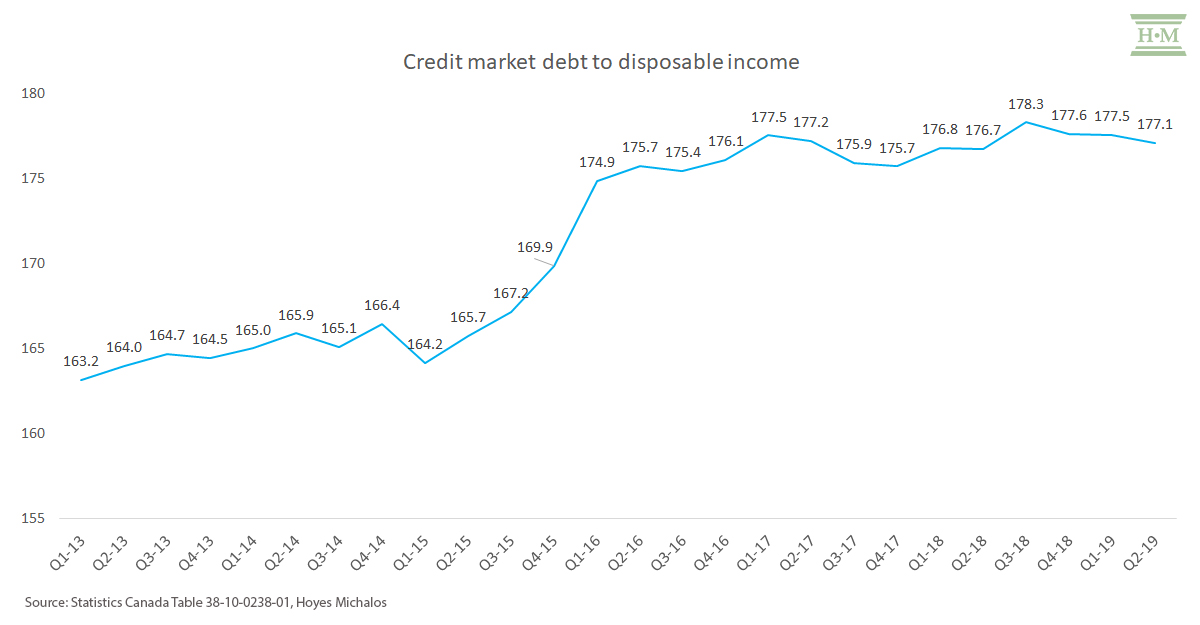
Both moderate wage growth and a deceleration in consumer credit growth have held the line on the infamous debt-to-income ratio. In Q2 2019, credit market debt-to-income was 177.1, down marginally from 178.3 in Q3 2018.
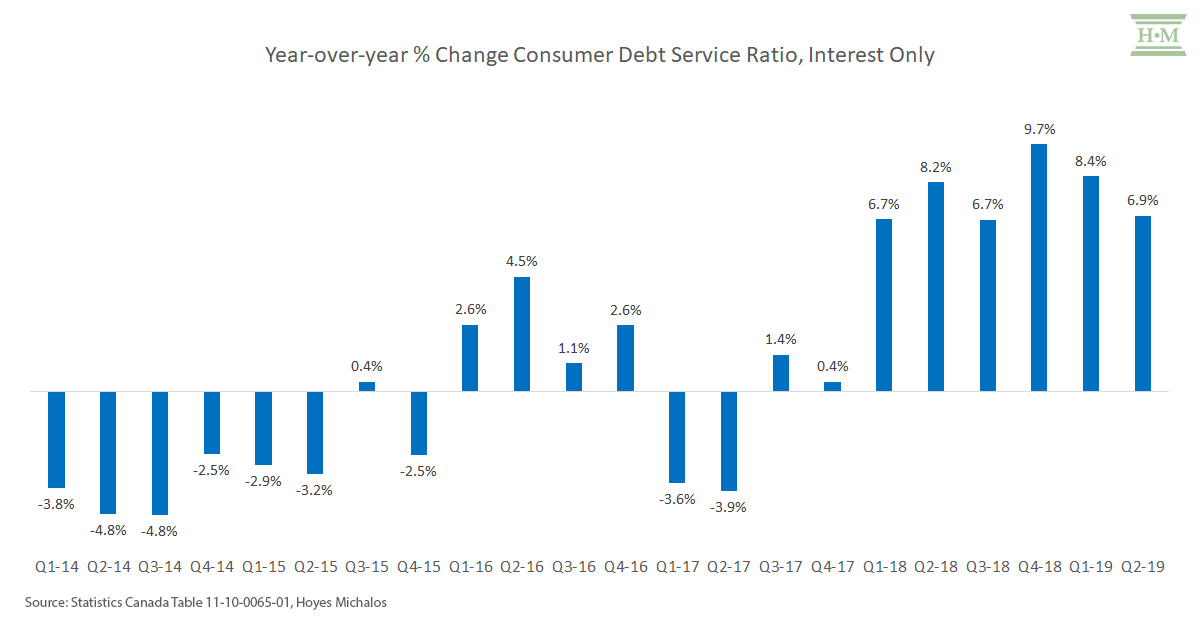
While the pace of growth in consumer credit has slowed, that doesn’t change the fact that all this historical debt needs to be repaid. And, like other living expenses, the cost to carry this debt has also outstripped wage growth.
The debt-service-ratio on consumer credit reached 8.16% in Q2 2019. It has increased an average of 4.5% in the first half of 2019 over the first half of 2018. Worse, interest-only servicing costs on consumer credit rose an eye-popping 7.6% during this same period.
A portion of this is driven by the rapid increase in unsecured personal lines of credit. According to the Bank of Canada, outstanding balances for non-mortgage personal lines of credit rose 2.4% annually in the first 9 months of 2019, compared to just 0.3% in 2018.
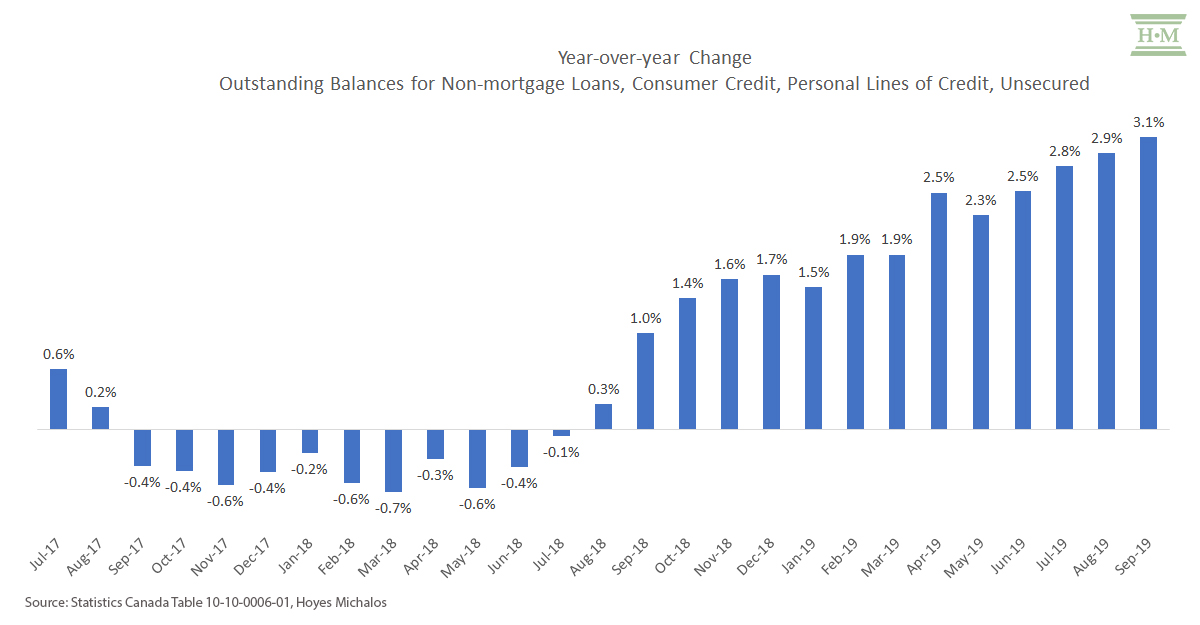
These are not HELOCs. These are unsecured personal lines used primarily to fund living costs, often as a replacement for credit card debt. Major banks have increasingly pushed these products on unsuspecting consumers, as have new entrants to the markets including traditional payday lenders. Unlike credit card debt, the rates on these lending products increase, often without warning. The shock can tip a barely balanced budget into the negative quickly.
More Canadians have less available to repay debt
All this means is that those with unsecured consumer debt are facing higher debt repayment costs, with less money available in their household budget to make those payments. For an increasing percentage of those with debts, the burden is no longer manageable.
In 2018, the average insolvent debtor had just $273 available after paying living expenses to put towards debt repayment on an average unsecured debt balance of $49,289. For vulnerable households, their debt is rising, and their available income is dropping.
The median household income for an insolvent debtor has been rising at a rate of 5% per year. No, average Joe debtor is not making 5% more. Rather, people with a marginally higher income than in prior years are now filing insolvency. As basic living costs and higher debt repayment demands continue to outstrip wage growth, this trend will continue. A decline in the stigma of filing bankruptcy, coupled with the option of making a consumer proposal, means people are not waiting to fall months in arrears. They are choosing to act earlier.
In summary: What matters and what does not
The traditional economic indicators that drive insolvencies are not the triggers of today’s rapid increase. Unemployment is irrelevant. Mortgage debt and mortgage rates are not relevant.
Everyone wants to focus on residential mortgages as a household risk factor and I get it. Residential mortgage debt is 2.5 times that of consumer credit. But insolvency deals with unsecured debt, in other words much of what makes up consumer credit.
Lastly, even delinquencies are irrelevant as extremely indebted households are just tired of the constant struggle to repay debt with more debt.
What is relevant is that financial institutions and low interest rates helped create a consumer credit binge we thought would never end. People don’t borrow money expecting they won’t repay it. Yet that is what is happening. As debt repayment and every-day living costs outstrip earnings for an ever-increasing portion of middle-income earners, who cannot rely on asset growth to fund the gap, insolvencies will rise.
That is why I believe that this uptick in filings won’t be slowing down anytime soon. This is only the beginning. And if we see a recession, if housing prices fall or stagnate, that opens the risk to a whole new rung of asset-owing Canadians who may need to file insolvency to dig themselves out.
The downpour will become a deluge.
Update: In March 2020 the Coronavirus crisis impacted consumer’s ability to manage debt.
Every year we choose 10 key statistics that most accurately tell the story of what’s happening with consumer debt in Canada and Ontario.
Here are our top 10 debt statistics for 2019:
- Ontario bankruptcies and consumer proposals increased by 15.9% in the first ten months of 2019, while Canadian insolvencies increased 9.7%. The pace of growth is accelerating.
- Average weekly earnings have only risen 2.5% in the first 9 months of 2019.
- The average insolvent debtor spends 31% of their household budget on food.
- Food costs have increased 3.4% in the first 10 months of the year and were up 3.7% year-over-year in October 2019.
- The average insolvent debtor spends 40% of their household income on housing costs.
- 95% of insolvencies involve renters. Almost half of renters in Ontario (46%) spend over 30% of their income on rent and utilities, with 21% spending more than 50% of their income on housing.
- Median rental rates in Canada were up 8.9% in October 2019.
- The balance of consumer credit reached $640 billion in October 2019, up 2.7%, from October 2018.
- The interest only portion of debt servicing costs increased 7.6% in the first half of 2019.
- Outstanding balances on unsecured lines of credit increased 2.4% in the first 9 months of 2019.
Sources:
- http://strategis.ic.gc.ca/eic/site/bsf-osb.nsf/eng/h_br01011.html
https://www.hoyes.com/press/consumer-insolvency-statistics/ - Statistics Canada Table 14-10-0223-01
https://www.hoyes.com/press/joe-debtor/ - Statistics Canada Table 18-10-0004-01
https://www.hoyes.com/press/homeowner-bankruptcy-index/ - Rentals.ca data
- Statistics Canada Table 10-10-0118-01
- Statistics Canada Table 11-10-0065-01
- Statistics Canada Table 10-10-0006-01
Similar Posts:
- 2023 Debt Statistics and What It Means for Consumer Insolvencies
- Will Homeowner Insolvencies Rise and By How Much?
- Debt Statistics: What Happened to Debt During the Pandemic & Recovery of 2021
- Top 10 Debt Statistics For 2022 and What’s Ahead for Consumer Insolvencies
- Insolvency Predictions Post COVID-19